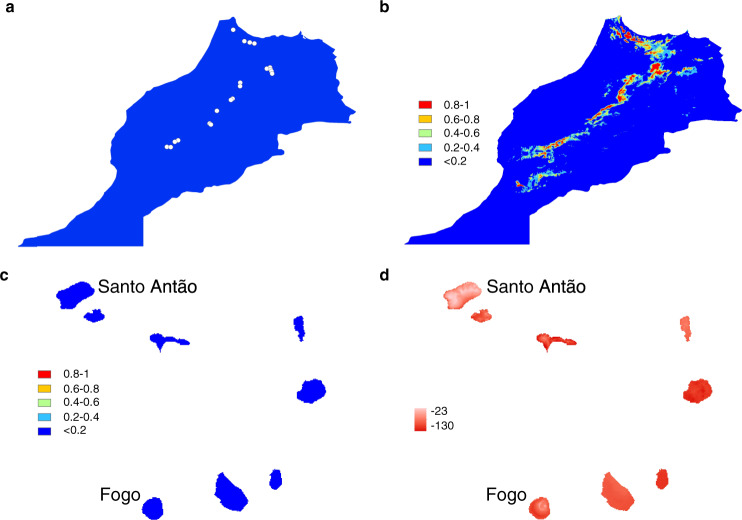
Fig. 4. Moroccan and CVI predicted distributions.
a Moroccan A. thaliana occurrence locations and (b), predicted climate envelope within Morocco. In (b, c) colours represent the predicted probability of occurrence and habitat suitability, with blue indicating low probability and red high. c Predicted climatic suitability for Moroccan Arabidopsis in CVI and (d), predicted similarity of CVI climate to the Moroccan A. thaliana climate envelope expressed as a percentage of how dissimilar each point is in relation to the range of values used in the model. More negative (red) values indicate higher dissimilarity relative to Morocco. Maps were produced using ESRI ArcGIS.

