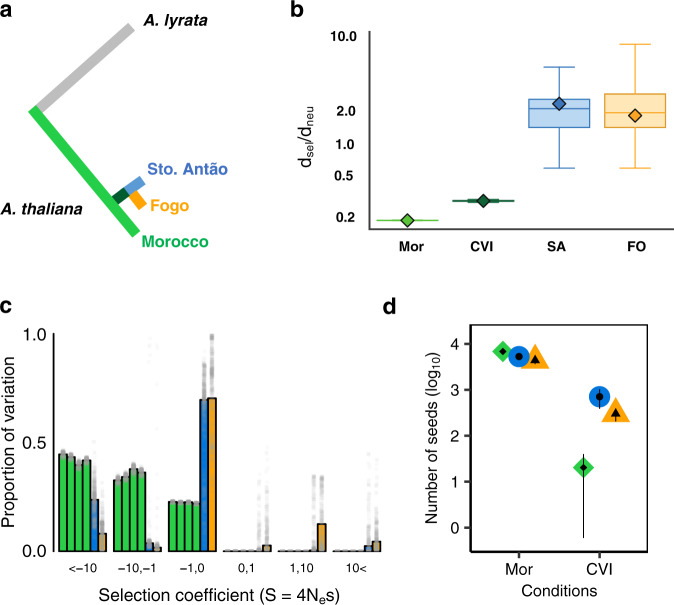
Fig. 5. Population genetic signatures of adaptive evolution in CVI.
a Schematic of phylogeny separating branches examined in dsel/dneu analysis. b Evolutionary rate ratios dsel/dneu across populations (observed data shown as diamonds) with n = 500 bootstrap resampling replicates showing median (line), 1st and 3rd quartiles (bounds of box), minimum and maximum (whiskers). Mor: Morocco; CVI: branch between Morocco and CVI; SA: branch from the island split to Santo Antão; FO: branch from the island split to Fogo. c Distribution of fitness effects for Morocco (green), Santo Antão (blue), and Fogo (orange). Grey dots represent estimates from 500 bootstrap analyses. d Fitness scaled to seed number in CVI and Moroccan lines under CVI and Moroccan conditions. Medians per population are shown by the dots, and 95% CI by the whiskers. Y-axis values are log10 transformed. Source data are provided as a Source Data file.

