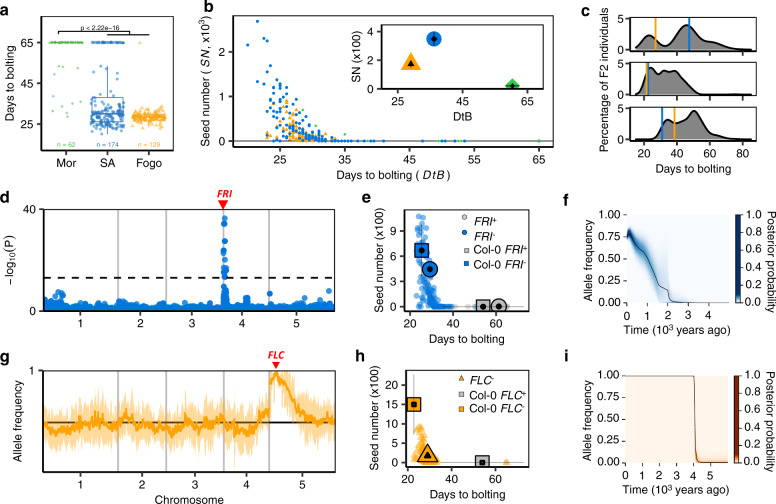
Fig. 7. Adaptation through parallel reduction in flowering time in CVI.
a Bolting time in CVI relative to Morocco with two-sided MWW test to compare distributions (p-value < 2.2 × 10⁻¹⁶). Boxplots show median (centre), 1st and 3rd quartiles (lower and upper bound, respectively). Whiskers represent 95% CI. b Days to bolting versus fitness (seed number); inset: means and 95% CIs. c Bolting time is transgressive across islands in three inter-island F2 populations. Vertical lines represent medians of days to bolting across replicates of the Santo Antão (blue) and Fogo (orange) parents. d Bolting time GWAS in Santo Antão. Dashed line represents Bonferroni-corrected genome-wide significance. e Effects of FRI alleles on bolting time and seed number under simulated CVI conditions (n = 189). Small symbols represent individual lines, large symbols population means with 95% CI (whiskers). f Inferred allele frequency trajectory of the derived FRI 232X in Santo Antão. The black curve represents the posterior mean of the allele frequency and the coloured area the posterior distribution. g Frequency distribution of the Fogo allele in an early flowering bulk from an inter-island F2 population reveals a peak at FLC. Median frequency per window (line) and one standard deviation (shading) are shown. h Effects of FLC alleles on bolting time and seed number under simulated CVI conditions (n = 146) as in (e). i Inferred allele frequency trajectory of the derived FLC 3X allele in Fogo, as in (f). Source data are provided as a Source Data file.

