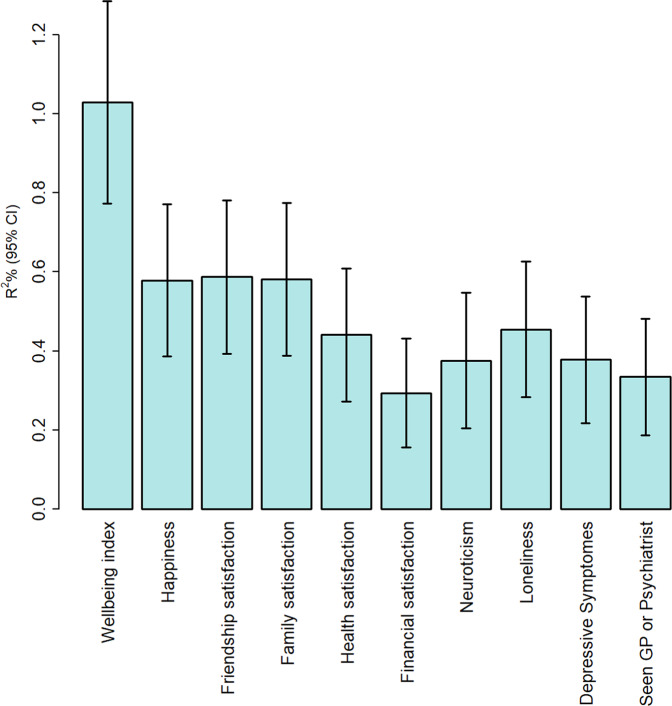
Fig. 4. Variance explained by polygenic scores derived from the wellbeing index discovery GWAS in the replication cohort for wellbeing index score, its subcomponents and related negative mental health indicators.
The y-axis shows the incremental R2% and for binary variables (Loneliness, Depressive symptoms, and Seen GP or Psychiatrist) Nagelkerke R2. Error bars are lower and upper bound of 95% confidence intervals. While variance explained was <1%, P-values were all highly significant (p = 3.55 × 10⁻¹⁴ – 5.68 × 10−56).

