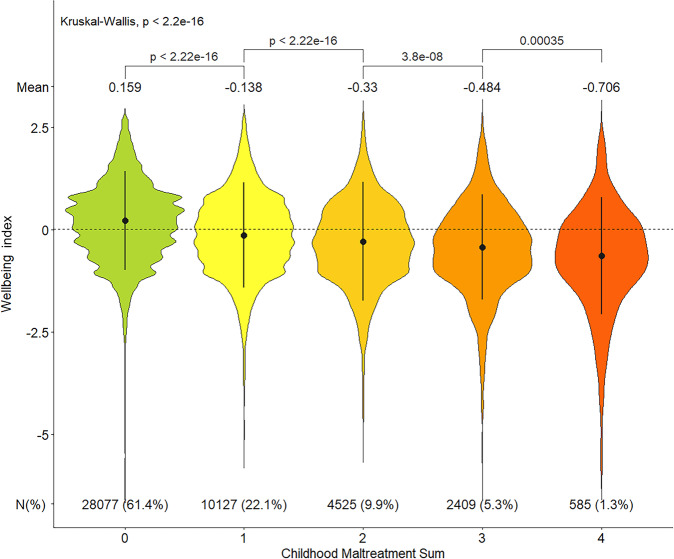
Fig. 5. The impact of multiple childhood maltreatment exposure on the wellbeing index.
The x-axis shows the childhood maltreatment sum score which represents number of childhood traumas in each group (0 = no trauma, 4 = experienced all four types of traumas). The y-axis is the wellbeing index z-score. The mean of wellbeing index z-score for each group is shown above each violin plot. The mean difference in wellbeing index between all categories was examined using Kruskal–Wallis test (p < 2.2 × 10⁻¹⁶). The pairwise mean difference between two adjacent groups employed the Wilcoxon test and the p-values are presented. The interquartile range is represented by vertical black lines inside the violin plots, and the dotted horizontal line is the median wellbeing index score in the sample (n = 45,723). The number of participants in each group is shown at the bottom of each category.

