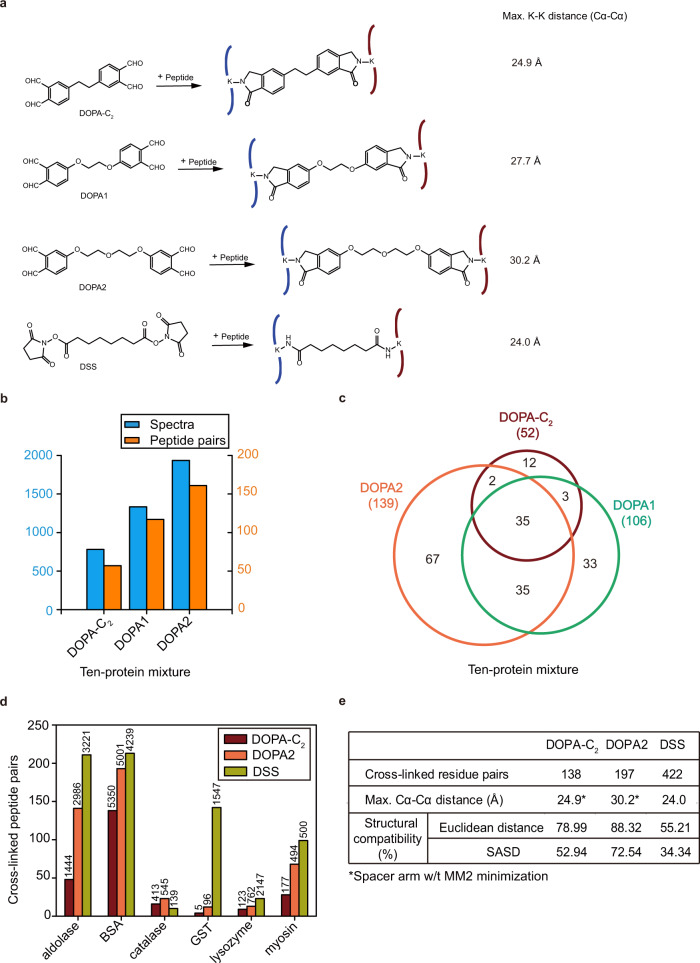
Fig. 3. Evaluating the performance of DOPA.
a Cross-linking products of DOPA-C2, DOPA1, DOPA2, and DSS with peptides. b Cross-links identified from a ten-protein mixture using DOPA-C2, DOPA1, and DOPA2. The number of cross-linked spectra is plotted with blue columns, and the number of cross-linked peptide pairs is plotted with orange columns. c Venn diagram showing the overlap of residue pairs produced by DOPA-C2, DOPA1, and DOPA2 from the ten-protein mixture. Identified cross-links were filtered by requiring an FDR < 0.01 at the spectra level. d Performance of DOPA-C2, DOPA2, and DSS on model proteins. Numbers of cross-linked peptide pairs are indicated with the colored columns, and spectra identified from each sample are shown above the columns. Two independent cross-linking experiments were performed for each protein sample, and analyzed by LC-MS/MS. Identified cross-links were filtered by requiring a FDR < 0.01 at the spectra level. e The table displays the percentage of residue pairs that are consistent with the structures of the model proteins, calculated by the use of the Euclidean distance or the solvent accessible surface distance. It also gives the maximum distance restraints and the number of cross-links belonging to each linker. Identified cross-linking residue pairs were filtered by requiring FDR < 0.01 at the spectra level and with spectral counts ≥ 3. Source data for b-e are provided as a Source Data file.

