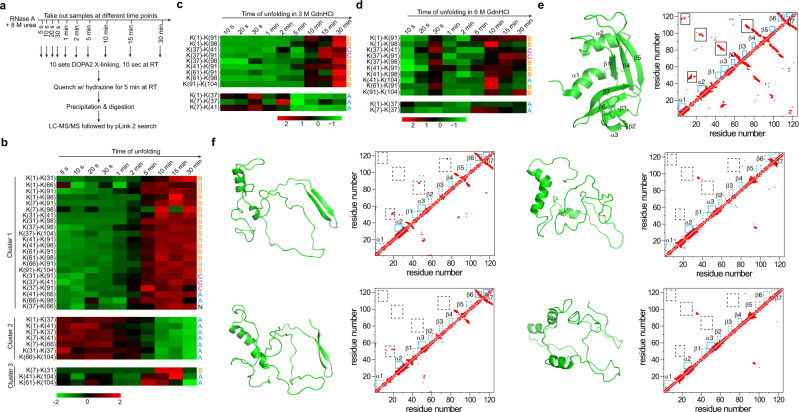
Fig. 8. Analysis of the RNase A unfolding process by DOPA2 cross-linking.
a Experimental workflow of DOPA2 cross-linking of RNase A after it was exposed to 8 M urea for the indicated amount time. b Heatmap representation of the abundance changes of the identified cross-linked residue pairs. Spectral counts were used to estimate abundance changes. The cross-linked residue pairs were classified into three K-means clusters. “N” means that the cross-link did not make the cutoff for identification in the experiment of Fig. 7d. Cross-linking residue pairs were filtered by requiring FDR < 0.01 at the spectra level, E-value < 1 × 10⁻⁸, and spectral counts > 3. c As in (b), but in 3 M GdnHCl. d As in (b), but in 6 M GdnHCl. Cross-linked residue pairs in (c, d) were filtered by requiring FDR < 0.01 at the spectra level, E-value < 1 × 10⁻⁴, and spectral counts > 3. e The crystal structure of RNase A (PDB code: 6ETK68) and the contact map of native RNase A. The secondary structures of RNase A are labeled with blue boxes, while the mainly tertiary structures are labeled with black boxes. f Four categories of simulated structures of RNase A in 8 M urea. Compared with the native structure, the lost secondary and tertiary structures are represented by dashed blue boxes and black boxes, respectively. Source data for (b–d) are provided as a Source Data file.

