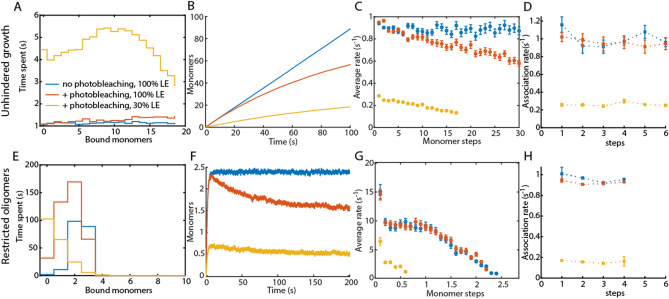
Figure 3.
Effect of photobleaching and labeling efficiency on unhindered growth and restricted growth that stops after the assembly of four monomers. Both unhindered (A–D) and restricted growth (E–H) were simulated using k+poly = 1/s and k−poly = 0.1/s. The visitation analysis (A, E), average rates (C, G) extracted from the average traces (B, F) and dwell-time analysis (D, H) were applied to data with 100% labeling efficiency and no photobleaching (blue data). The average trace of restricted growth reaches only 2.5 monomers, despite possible growth until 4 monomers, because of the equilibrium between the on- and the off-rate. The effect of a photobleaching rate of 0.01/s does not significantly influence the extracted rates and the visitation analysis (red data). The combination of stochastic labeling of 30% and photobleaching with a rate of 0.01/s affects all analysis methods (yellow). Error bars for the dwell-time analysis represent the 95% confidence intervals of the exponential fit.

