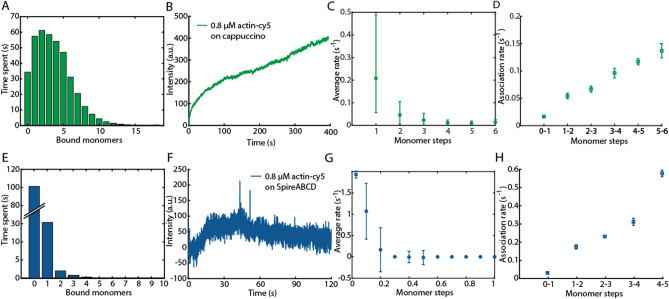
Figure 4.
Experimental data of 30% stochastically labeled actin-Cy5 growing on Cappuccino and Spire-ABCD. A comparison between a visitation analysis, dwell-time analysis and average rate analysis is performed for the measurements with Cappuccino (A–D, green) and Spire-ABCD (E–G, blue). (A, E): The visitation analysis, (B, F) average intensity, (C, G) fractional average-rate analysis and (D, H) dwell-time analysis showing the first 5 monomer association steps from 700 individual traces are plotted. The fractional average rates have been calculated using the time until the average trace reached the intensity change corresponding to 0.1 monomers (i.e. between 0 and 0.1, between 0.1 and 0.2, between 0.2 and 0.3, etc.). Fractional average rates are 10 times faster than average rates because the average intensity of only 1/10 of a monomer has to be reached. The experimentally determined photobleaching rate was 0.025/s.

