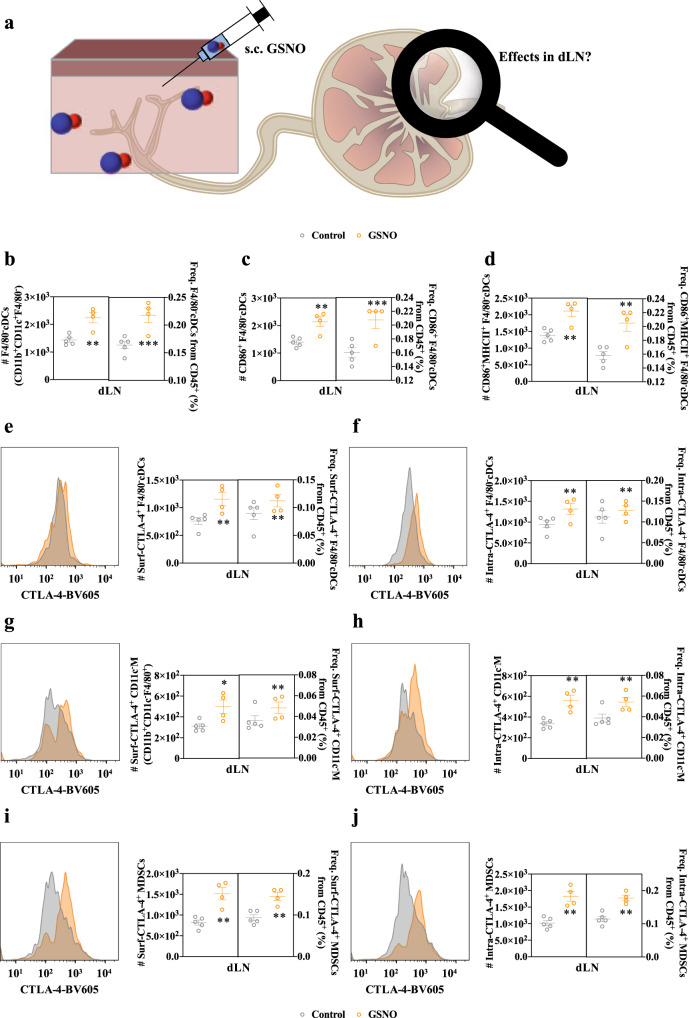
Fig. 1. Subcutaneously injected GSNO influences on antigen presenting cell levels and expression of CTLA-4 in LNs draining the tissue site of injection.
Immune phenotyping of dLN leukocyte populations 1 day after treatment of GSNO (570 μg kg−1) in 30 μL saline. Gating strategy can be found in Supplementary Fig. 1. a Schematic illustration to investigate the effects of subcutaneously injected GSNO on immune cells in dLN. b–d Number and frequency of (b) CD45+CD11b+CD11c+F4/80− cDCs (F4/80−cDCs) (left p = 0.0321 and right p = 0.0046), (c) CD86+ activated F4/80−cDCs (CD86+ F4/80−cDCs) (left p = 0.0485 and right p = 0.0087), and (d) CD86+ and MHCII+ activated F4/80−cDCs (CD86+MHCII+ F4/80−cDCs) (left p = 0.0466 and right p = 0.0120) within dLNs. e–j Representative histograms (left) and number and frequency of cell subpopulation (right) of (e, g, i) surface and (f, h, j) intracellularly expressed CTLA-4 by various dLN leukocyte populations. e, f F4/80−cDCs (e left p = 0.0277, e right p = 0.0480, f left p = 0.0298, and f right p = 0.0321). g, h CD11b+CD11c-F4/80+ macrophages (CD11c-M) (g left p = 0.0772, g right p = 0.0377, h left p = 0.0396, and h right p = 0.0123). i, j CD45+CD11b+GR-1+ (MDSCs) (i left p = 0.0353, i right p = 0.0285, j left p = 0.0375, and j right p = 0.0192). Number and frequency data are presented as individual biological replicates and mean ± SEM. b–j n = 5 for control and n = 4 for GSNO. *****p < 0.0001, ****p < 0.001, ***p < 0.01, **p < 0.05, and *p < 0.1 by two-tailed Student t-test. Source data are available in a Source Data file.

