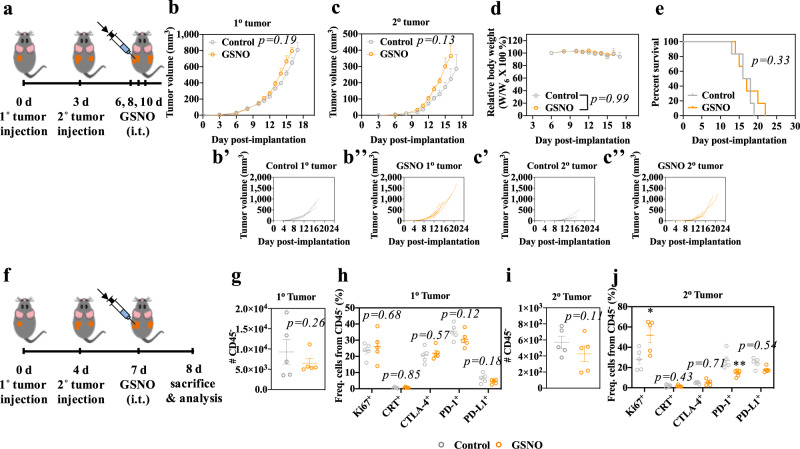
Fig. 2. Intratumorally administered GSNO effects on tumor growth.
a Tumor model and treatment schedule. 1o and 2o tumors were formed in C57Bl/6 mice by inoculation of 105 B16F10-OVA cells in 30 μL saline on day 0 and day 3, respectively. GSNO (570 μg kg−1) in 30 μL saline was administered on day 6, 8, and 10. b, c Average and (B', B'', C', C'') individual volumes of (b) 1o (directly injected) and (c) 2o tumors (uninjected). d Relative body weight changes post treatment. e Kaplan–Meier survival curves. f Tumor model and treatment schedule. 1o and 2o tumors were formed by inoculation of 105 B16F10-OVA cells in 30 μL saline on day 0 and day 4, respectively. GSNO (570 μg kg−1) was administered i.t. on day 7. Gating strategy can be found in Supplementary Fig. 22. g–j Number or frequency of each population of the indicated parent gate in the (g, h) 1o or (i, j) 2o tumor. g, i CD45−; h, j Ki-67+ (j p = 0.0677), CRT+, CTLA-4+, PD-1+ (j p = 0.0144), and PD-L1+ of CD45−. Data are presented as individual biological replicates and mean ± SEM. b–e n = 6. g–j n = 5. *****p < 0.0001, ****p < 0.001, ***p < 0.01, **p < 0.05, and *p < 0.1. b, c ANOVA using linear mixed-effects model. d Two-way ANOVA using Tukey post-hoc statistical hypothesis. e Log-rank using Mantel–Cox statistical hypothesis. g–j Two-tailed Student t-test. Source data are available in a Source Data file.

