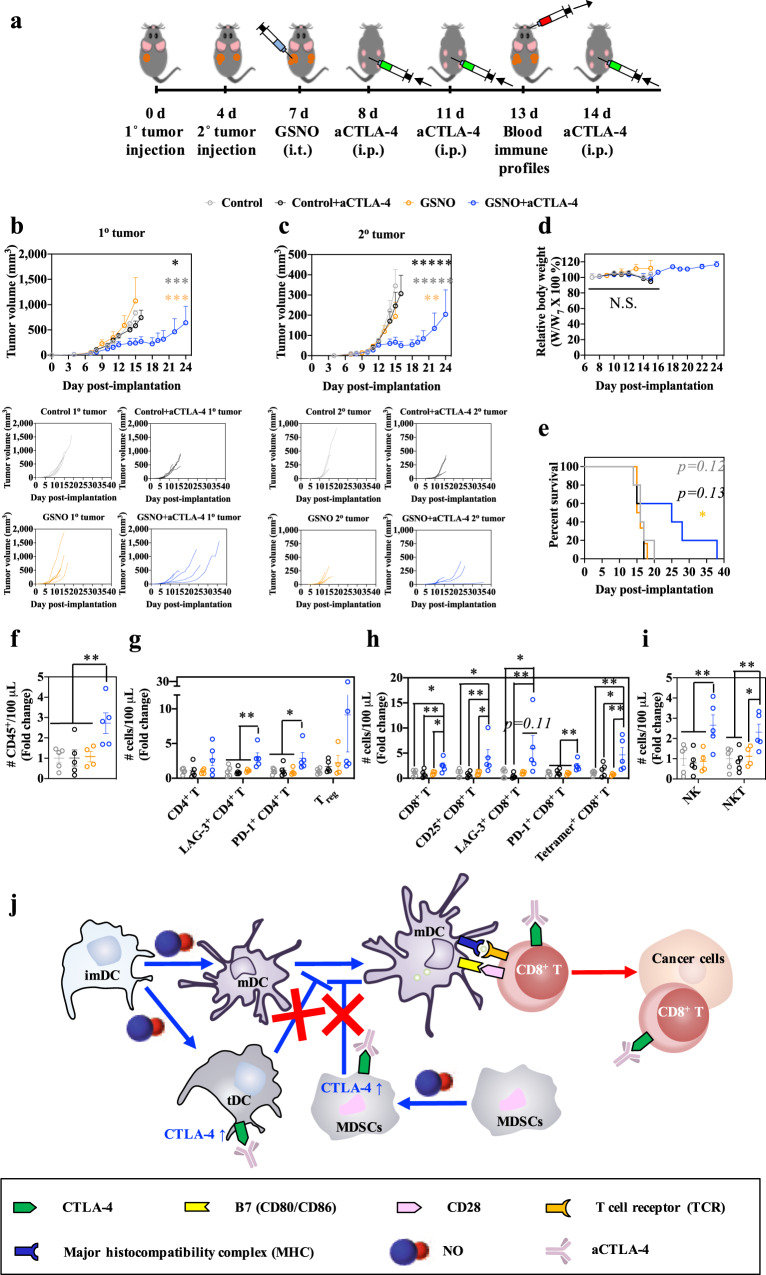
Fig. 3. Direct and abscopal therapeutic effects and immunomodulation by GSNO and aCTLA-4 combination therapy.
a Tumor model and treatment schedule. 1o and 2o tumors were formed in C57Bl/6 mice by inoculation of 105 B16F10-OVA cells in 30 μL saline on day 0 and day 4, respectively. GSNO (480 μg kg−1) in 30 μL saline was intratumorally treated on day 7, and aCTLA-4 (100 μg mouse−1) in 30 μL saline was intraperitoneally administered on day 8, 11, and 14. Blood was harvested from the facial vein on day 13 for the profiling of blood immune cells. b Average and individual volumes of 1o (directly injected) tumors. c Average and individual volumes of 2o (uninjected) tumors. d Relative body weight changes post treatment. e Kaplan–Meier survival curves. f–i Relative blood abundance of f CD45+, g CD45+CD3+CD4+ T (CD4+ T), LAG-3+ CD4+ T, PD-1+ CD4+ T, and CD45+CD3+CD4+CD25+Foxp3+ (Treg), h CD45+CD3+CD8+ T (CD8+ T), CD25+ CD8+ T, LAG-3+ CD8+ T, PD-1+ CD8+ T, and tetramer+ CD8+ T, and i CD45+CD3-NK1.1+ (NK) and CD45+CD3+NK1.1+ (NKT). Data are presented as individual biological replicates and mean ± SEM. b–e n = 5 for Control, Control+aCTLA-4, and GSNO + aCTLA-4, and n = 6 for GSNO. f–i n = 5 for Control, Control+aCTLA-4, and GSNO + aCTLA-4, and n = 4 for GSNO. *****p < 0.0001, ****p < 0.001, ***p < 0.01, **p < 0.05, and *p < 0.1. Exact p-values for b, c and e–i are reported in Supplementary Table 1 and 2. b, c ANOVA using linear mixed-effects model. d Two-way ANOVA using Tukey post-hoc statistical hypothesis. e Log-rank using Mantel–Cox statistical hypothesis by comparing the GSNO + aCTLA-4 with control groups. f–i One-way ANOVA using Tukey post-hoc statistical hypothesis. j Proposed actions of combinational use of GSNO and aCTLA-4 on immune response. Blue arrows indicate the mechanism associated with GSNO. Red arrows and crosses represent mechanisms associated with aCTLA-4. Source data are available in a Source Data file.

