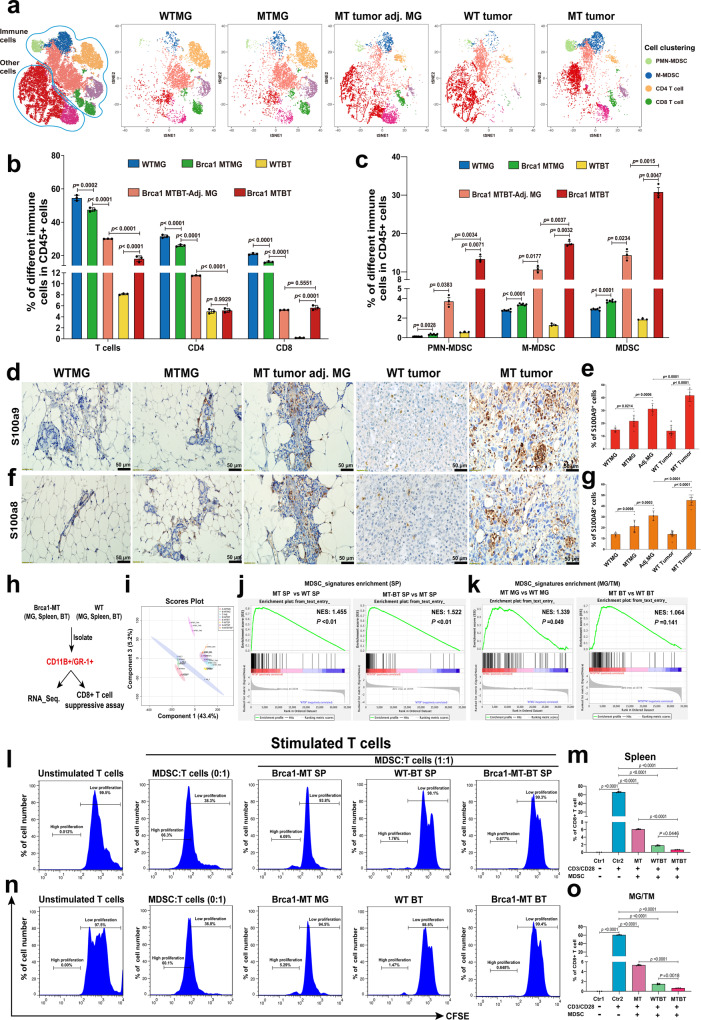
Fig. 1. Brca1 deficiency induces immunosuppression in mammary glands and tumors.
a tSNE analysis of immune cells from wildtype (WTMG, n = 6 mice), Brca1-mutant mammary glands (MTMG, n = 6 mice), Tu-Adj. mammary tissues (MT tumor adj. MG, n = 3 mice) from Brca1-MT mice, WT breast tumor (WT BT, n = 3 mice) and breast tumor (MT BT, n = 3 mice) from Brca1-MT mice. b, c The cell populations were classified as total T-cells (CD45+CD3e+), CD4+ T cells (CD45+CD3e+CD4+ and CD8-), CD8+ T cells (CD45+CD3e+CD4-CD8+), MDSCs (CD45+CD11b+Gr1+), PMN-MDSCs (CD45+CD11b+Ly6G+Ly6C-), and M-MDSCs (CD45+CD11b+Ly6G-Ly6C+). b Quantifications of total T-cells, CD4, and CD8 cells. c Quantifications of PMN-MDSCs, M-MDSCs, and total MDSCs by FlowJo analysis (Cytof gating strategies see in Supplementary Fig. 8a, n = 3–6 mice same in a). d–g Representative images of IHC staining with antibodies of S100a9 (d) or S100a8 (f), and quantifications of S100a9 (e) or S100a8 (g), (n = 6–15 pictures from 3 mice/group, 6 pictures from WTMG, 9 from MTMG, 6 from adj.MG, 15 from WTBT, and 9 from MTBT, the number of each group same in e and g). h The strategy of isolating CD11B+/GR1+ cells from mammary gland (MG), breast tumor (BT), and spleens (SP) for RNA-sequence and CD8 + T cells suppressive assay from the mice in a. i Principal Component Analysis (PCA) analysis of RNA-sequence data of CD11B+/GR1+cells in h (n = 3 mice/group). j MDSC signature genes enrichment in spleen by GSEA analysis by comparing gene expression from spleens of Brca1-MT (MT SP) vs WT (WT SP) mice and Brca1-MT mice with breast tumor (MT-BT SP) vs MT SP. k MDSC signature genes enrichment in mammary gland (MG) and breast tumor tissues (BT) by GSEA analysis by comparing gene expression from Brca1-MT mammary glands (MT MG) vs wild-type mammary glands (WT MG), and tumors from Brca1-MT (MT BT) and WT (WT BT) mice. l Representative CFSE flow-cytometry histograms and statistics from co-culture of WT T-cells with MDSCs from spleens. m Quantifications of % of CD8 + cells in each sample in l. The T-cell were from 2 months WT mice and MDSCs from spleens of 10-month Brca1-MT mice (Brca1-MT SP), Brca1-WT tumor-bearing mice (WT-BT SP) and Brca1-MT tumor-bearing mice (Brca1-MT-BT SP). Ratio of MDSC to T cells was 1:1 (n = 3 mice/group). n Representative CFSE flow-cytometry histograms and statistics from co-culture of WT T-cells with MDSCs from MG and BT. o Quantifications of % of CD8 + cells in each sample in n. The T-cell were from 2 months WT mice and MDSCs from MG of 10-month Brca1-MT mice (Brca1-MT MG), breast tumor tissues of Brca1-WT tumor-bearing mice (WT BT) and Brca1-MT tumor-bearing mice (Brca1-MT BT). Ratio of MDSC to T cells was 1:1 (n = 3 mice/group) (FACS gating strategies see in Supplementary Fig. 8b). The data are expressed as means ± SD (b, c, e, g, m–o) and P values determined by one-way ANOVA followed by Tukey’s multiple comparisons and permutation test. Scale bar: black color, 50 μM. Source data are provided as a Source data file.

