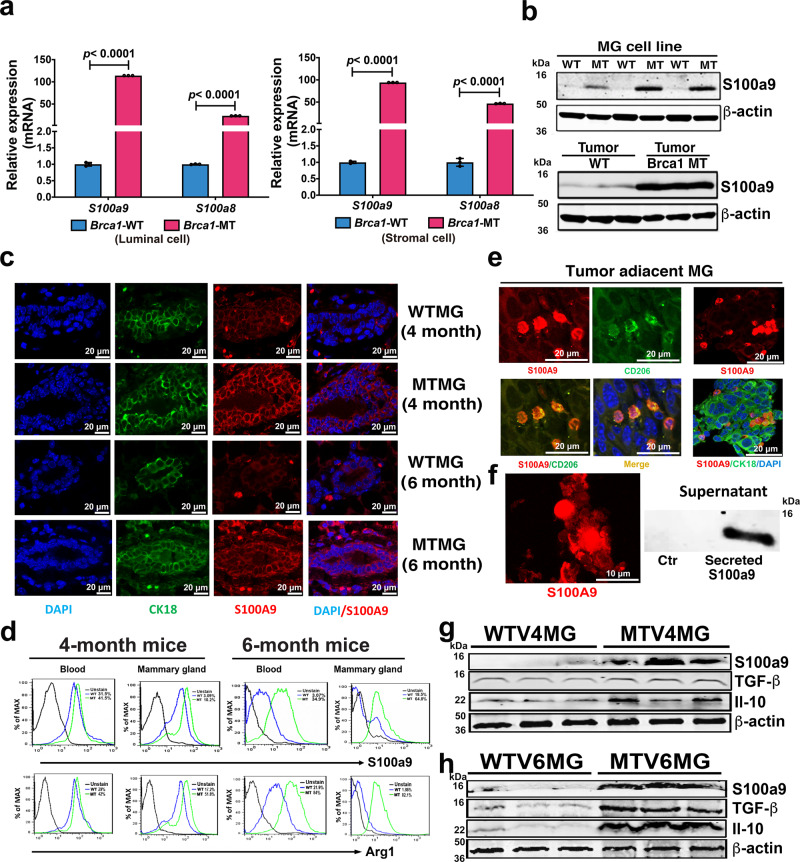
Fig. 4. Tumor permissive microenvironment in Brca1 MT mammary glands.
a S100a9/S100a8 mRNA expression in the subpopulations of luminal and stromal cells of WT 4-month mammary gland (WTV4MG) and MT 4-months-old virgin mammary gland (MTV4MG) (n = 3 mice). b Protein level of S100a9 in both WT (B477) and MT (G600) mammary epithelial cell lines and tumor tissues by Western blots (n = 3 individual experiment-up and n = 3 mice-down). c Co-staining of S100a9 (red) and CK18 (green) with antibodies on WTV4MG, MTV4MG, WTV6MG, and MTV6MG tissues (n = 3 pairs in each group, Scale bar: 20 μM). d The S100a9 and Arg1 positive cell populations by FACS analysis from the blood and mammary tissues of both WT and MT mice at 4-month and 6-month, respectively (FACS gating strategies see in Supplementary Fig. 8c, n = 3 mice/ group). e Co-staining with S100a9 (red) and CD206 (green) antibodies (left panel) and co-staining with S100a9 (red) and CK18 (green) antibodies (right panel) on tumor-adjacent tissues by IF (40X confocal microscope, Scale bar: 20 μM.) (n = 3 mice and 3 individual experiment). f Secreted S100a9 proteins (left) from both tumor cell and MDSC cells in tumor-adjacent mammary gland (n = 3 mice) and present in the supernatant of cultured cancer cells (right) (n = 3 individual experiment, Scale bar: 10 μM). g Protein levels of S100a9, TGF-β, and Il-10 in mammary gland tissues of both WT and Brca1 MT mice at 4-month (n = 3 mice). h Protein levels of S100a9, TGF-β, and IL-10 in mammary tissues of both WT and Brca1 MT mice at 6-month (n = 3 mice). The data are expressed as means ± SD (a) and P values determined by unpaired two-tailed Student’s t test. The experiments were independently repeated three times with similar results (a, b). Source data are provided as a Source data file.

