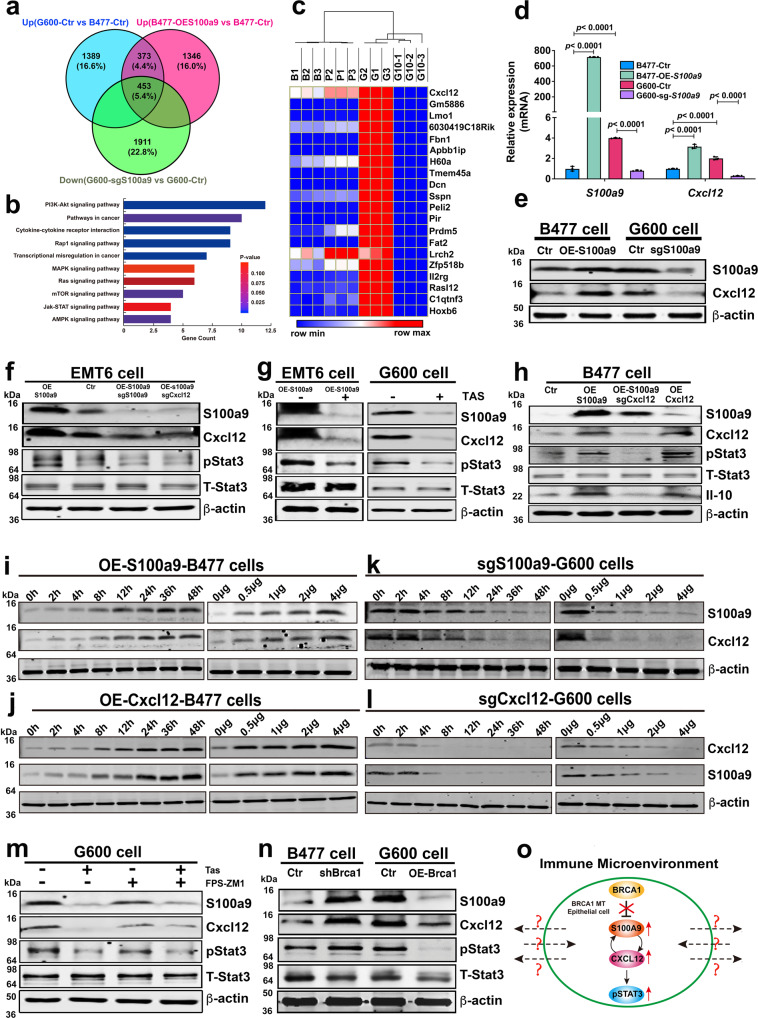
Fig. 5. Positive regulation loop between S100a9 and Cxcl12 amplifies oncogenic signals in Brca1-MT epithelial cells.
a The Venn diagram analysis of upregulated genes in G600, Over-Expression-S100a9 in B477 cells (B477-OE-S100a9), and down-regulated genes in G600 cells expressing sgS100A9 (G600-sgS100a9) (n = 3 biological replicates/group). b KEGG Pathway analysis with 453 common (p value was calculated by hypergeometric test with KOBAS 3.0 website). c Top 20 differentially expressed genes by comparison of the gene expression profiles of four different group cells, including B477-Ctr (B1-3), B477-OES100a9 (P1-3), G600-Ctr (G1-3), and G600-sgS100a9 (G10-1-3) (the heatmap was drawn by Morpheus website and clustered by One minus Pearson Correlation). d, e Expressions of S100a9 and Cxcl12 at mRNA level by qPCR (d) at protein levels by western blotting (e) from four group cells in c. f Protein levels of S100a9, Cxcl12 and pStat3 in OE-S100a9-EMT6 cells, sgS100a9/OE-S100a9-EMT6, and sgCxcl12/OE-S100a9-EMT6 cells. g Protein levels of S100a9, Cxcl12 and pStat3 in OE-S100a9-EMT6 and G600 cells without or with S100A9 inhibitor, Tasquinimod (Tas-50 μM) by western blotting. h Protein levels of S100a9, Cxcl12, and pStat3 in WT (B477) cells with the expression of OE-S100a9, OE-S100a9/sgCxcl12, or OE-Cxcl12 by western blotting. i, k Protein levels of Cxcl12 in B477 (i) cells with OE-S100a9 and in G600 (k) cells expressing sgS100a9 at different time courses (0–48 h) and different amounts (0–4 μg) by western blotting. j, l Protein levels of S100a9 in B477 (j) cells with OE-Cxcl12 and in G600 (l) cells expressing sgCxcl12 at different time courses (0–48 h) and different amounts (0–4 μg) by western blotting. m Protein levels of S100a9, Cxcl12, and pStat3 in G600 cells after treating with Tas and FPS-ZM1, inhibitor for RAGE receptors on cell membranes by western blotting. n Protein levels of S100a9, Cxcl12, and pStat3 in B477 cells with the expression of shBrca1 and MT G600 cells with over-expression of Brca1 (OE-Brca1). o A diagram summarizing the relationship of Brca1, S100a9, Cxcl12 and pStat3 in Brca1-MT mammary epithelial cells, and their potential interaction with the surrounding immune microenvironment, which remains elusive. The data are expressed as means ± SD (d) and P values determined by one-way ANOVA followed by Tukey’s multiple comparisons. The experiments were independently repeated three times with similar results (d–n). Source data are provided as a Source data file.

