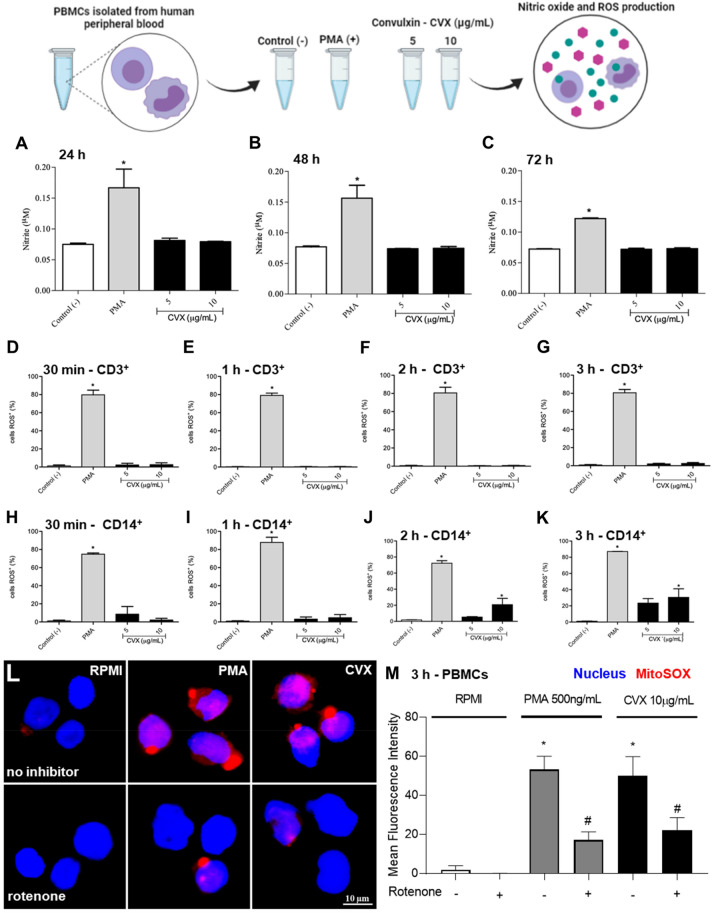
Figure 4.
Nitrite and ROS production in PBMCs in the presence of Convulxin. NO quantification in the supernatant of 2 × 10⁵ PBMCs and ROS determination in 1 × 10⁶ CD3+ and CD4+ cells with DCFDA were quantified by flow cytometer followed by stimulation with RPMI without phenol red (negative control), PMA (500 ng/mL; positive control) or CVX (5 and 10 μg/mL) for selected time intervals. NO concentrations were quantitated by Griess method in supernatant collected after incubation with RPMI, LPS or CVX. ROS were determined in CD3+ and CD14+ gated populations following the addition of DCFDA (10 μM), and the DCF fluorescence was determined in FL1 channel in FACScan. The results were expressed as μM of NO liberated (A–C) and % of cell producing ROS and represent the mean ± S.E.M of 3 donors (D–K). *P < 0.05 compared to negative control (Data were presented with ANOVA followed by Tukey post-test). The images were collected using constant automatic gain among the samples to quantify the differences in absolute levels of fluorescence intensity of different conditions in 100 × magnification oil immersion objective. Figure representative of one experiment of three independent experiments (L,M). Analysis of the mean fluorescence intensity of ROS immunofluorescence was performed using 10 cells in field of view of each condition collected impartially.

