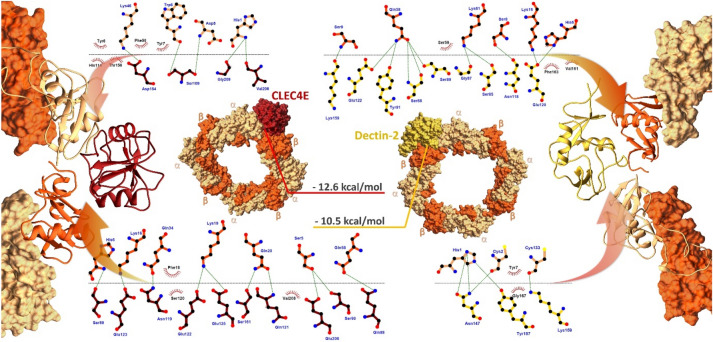
Figure 6.
Complexes formed in the interaction of CVX (β subunits in orange and α subunits in sandy brown) with ectodomains of C-type Lectins receptors CLEC4E (red) and Dectin-2 (yellow). The complexes displayed above are the extracted central structures from the largest cluster of each respective MD trajectory, both structures are approximations of the most predominant conformations assumed by these proteins during 10 ns of simulation. The ΔG in kcal/mol of each interaction interface is highlighted in lines colored according to its complex of origin. Residues coordinating the interaction interfaces are highlighted on the interaction maps with hydrogen bonds depicted in green dashed lines and hydrophobic interactions highlighted in red protrusions.

