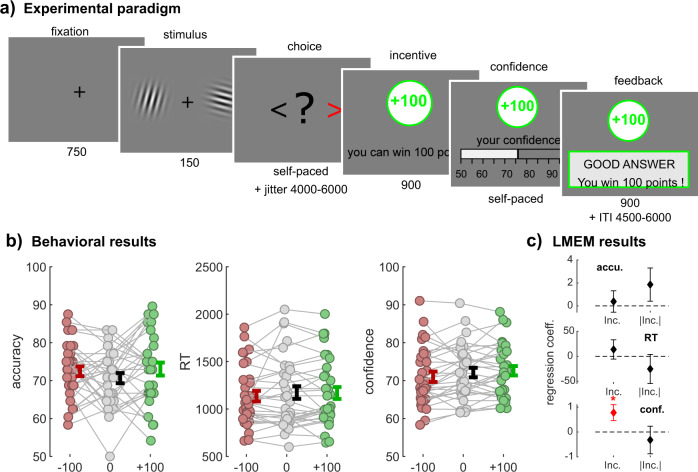
Fig. 1. Experimental design and behavioral results.
a Experimental paradigm. Participants viewed two Gabor patches on both sides of the screen (150 ms) and then chose which had the highest contrast (left/right, self-paced). After a jitter of a random interval between 4500 and 6000 ms, the incentive condition was shown (900 ms; green frame for win trials, gray frame for neutral trials, red frame for loss trials). Afterwards, participants were asked to report their confidence in the earlier made choice on a scale ranging from 50% to 100% with steps of 5%. The initial position of the cursor was randomized between 65% and 85%. Finally, subjects received feedback. The inter-trial interval (ITI) had a random duration between 4500 and 6000 ms. The calibration session only consisted of Gabor discrimination, without confidence rating, incentives, or feedback, and was used to adjust the difficulty so that every individual reached a performance of 70%. b Behavioral results. Individual-averaged accuracy (left), reaction times (middle) and confidence (right) as a function of incentive condition (−100/red, 0/gray, +100/green). Colored dots represent individuals (N = 32), gray lines highlight within-subject variation across conditions. Error bars represent sample mean ± standard error of the mean. Note that for confidence and accuracy, we computed the average per incentive level per individual, but that for reaction times, we computed the median for each incentive condition rather than the mean due to their skewed distribution. c Linear mixed-effect model (LMEM) results. The graph depicts fixed-effect regression coefficients (β) for incentive condition (Inc.) and absolute incentive condition (|Inc.|) predicting performance (top), reaction times (middle), and confidence (bottom). Error bars represent standard errors of fixed effects. *p < 0.05.

