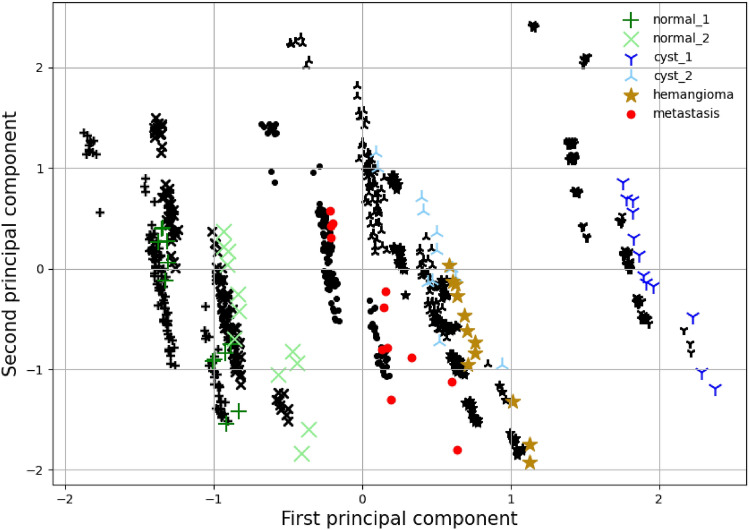
Figure 7.
FBP principal component analysis. The black markers indicate the empirical phantom study data of the region of interest with the same shape as the colored markers. The colored markers indicate the equivalent result of the simulator with the filtered back-projection reconstruction and the parameter range shown in Table 1. The average value and variability of the two principal components are matched up to a shift of the first principal component.

