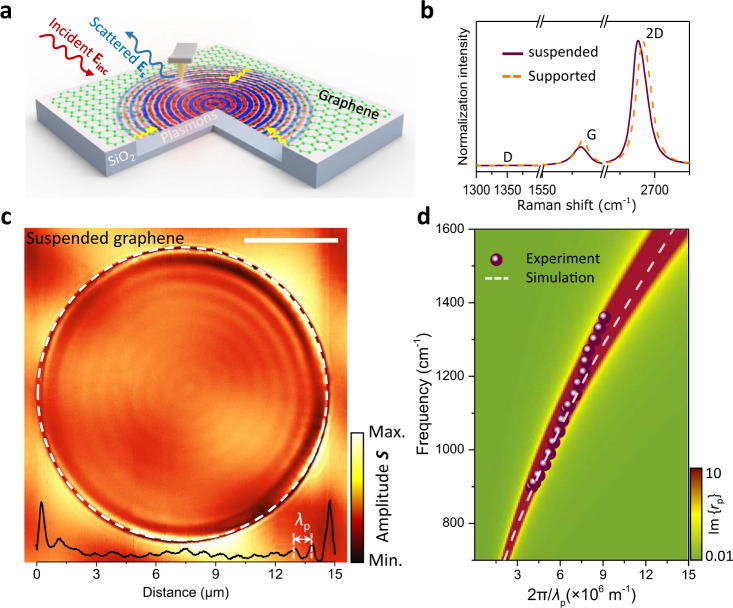
Fig. 1. Plasmonic response and intrinsic dispersion in suspended graphene structures.
a Sketch of experimental arrangement for launching and detecting plasmons propagating in suspended graphene. The tip and sample are illuminated with a focused infrared light wave (with wavelength λ0 and field Einc), which can induce dipoles around the hole edge, thus efficiently exciting the graphene plasmons (yellow arrows). The tip subsequently scatters the plasmons, and a distant detector measures the scattered field ES. Note that we use defocus processing to enlarge the spot size to ~30 microns and enhance the surrounding edge launching efficiency further. b Raman spectra of suspended and SiO2-supported regions of high-quality undoped graphene. c Near-field optical signal at λ0 = 10.87 μm (920 cm−1) light wavelength from a two-dimensional scan across the suspended graphene area with a circular diameter Φ = 15 μm and a suspension height ~450 nm. The interface between suspended and supported graphene regions is marked with a dashed white circle. The black curve at the bottom shows the near-field profile along with a horizontal cut through the center of the circular hole. The graphene Fermi energy is EF ~ 0.68 eV. The scale bar indicates 5 μm. λp represents the plasmon wavelength. d Experimentally measured (symbols, from a device with Φ = 2.5 µm and EF ~ 0.9 eV, shown in Supplementary Fig. 4) and simulated (white dashed curve, details in Methods) dispersion of suspended GPs. The loss function Im{rp(q, ω)}, calculated from the reflection coefficient rp in the random-phase approximation (RPA, details in Methods), is shown as a pseudo-color-plot background.

