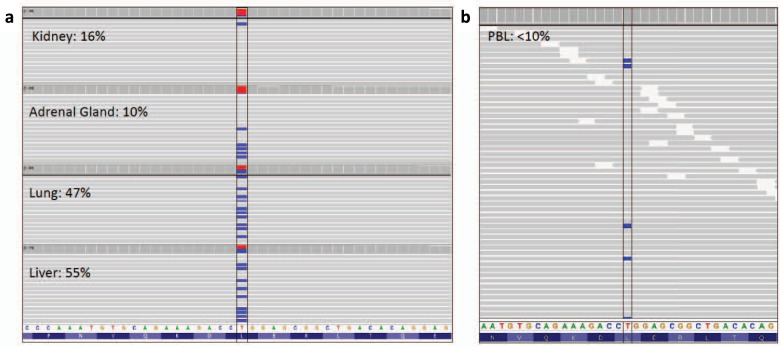
Fig. 2. Visualization of VHL variant in tumor and germline DNA.
Integrative Genomics Viewer display of the c.593 T > C (p.Leu198Pro) variant in tissue from four tumor specimens (a) and peripheral blood leukocytes (b). The percentage of sequencing reads (gray bars) depicting the variant are beside the biospecimen type. The blue bars depict a cytosine nucleotide instead of a thymine nucleotide at the variant loci. The overall proportion of cytosine:thymine reads is represented by the blue:red bars at the top of each tissue panel. Tumor cellularity was estimated by a pathologist to be 65% in the kidney tissue and 85% in the adrenal gland, lung, and liver tissue.

