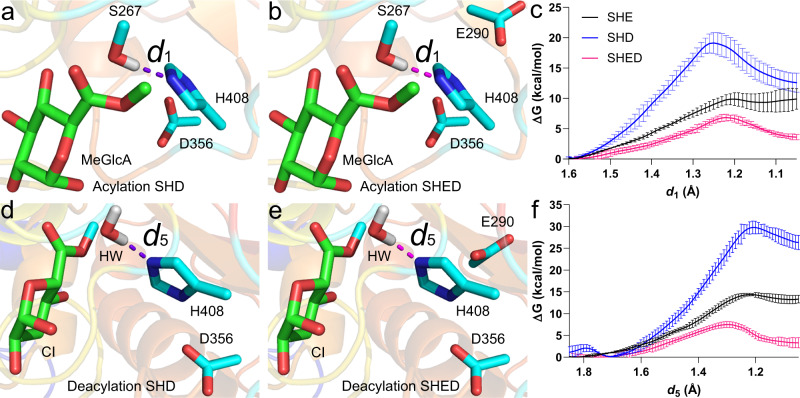
Fig. 5. Initial proton transfers in the acylation and deacylation steps with the optimal SHED QM region.
a–c Acylation step. d–f Deacylation step. In (a, d), QM areas of SHD include only one acidic residue for the calculations of acylation and deacylation, respectively. In (b) and (e), QM areas of SHED comprise two acidic residues for the calculations of acylation and deacylation, respectively. (c, f) show the relevant free-energy profiles generated from QM/MM simulations. The corresponding results of SHE (black lines) are shown for reference. Data are presented as mean values ± the standard error inferred from three independent runs. Source data for c, f are provided as a Source Data file.

