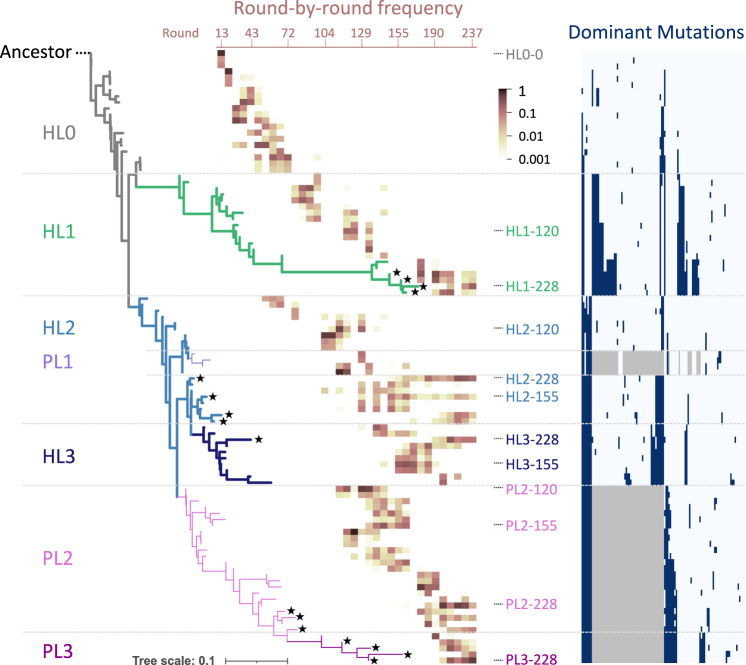
Fig. 2. Phylogeny of consensus host and parasitic RNA genotypes.
The three most frequent host and parasitic RNA genotypes in all sequenced rounds are shown, with the ancestral host RNA (“Ancestor”) designated as the root of the tree. Branches comprising the defined lineages are colored differently. Host (HL0–3) and parasitic (PL1–3) RNA lineages are shown as thick and thin lines, respectively. The heatmap superimposed on the tree shows the frequencies of each genotype in total host or parasitic RNA reads over all sequenced rounds (from left to right). Black star shapes at the tips of branches mark genotypes that remained in the last sequenced round. Genotypes used for biochemical analysis are indicated with the names of the corresponding RNA clones if presented in the tree. The list of dominant mutations is shown on the right; navy and gray colors indicate the presence of a point mutation and deletion, respectively. An enlarged view of the list is presented in Supplementary Fig. S2.

