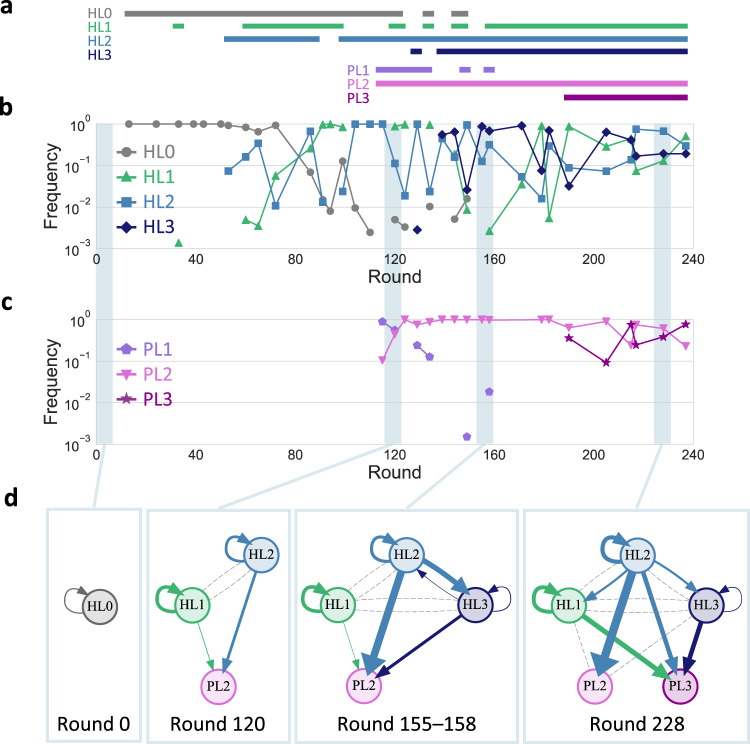
Fig. 3. Development of replicator networks.
a–c Frequencies of the lineages in total sequence reads of the analyzed genotypes for the host (b) and parasitic (c) RNAs, with horizontal lines above the graphs (a) indicating rounds where the frequency of each lineage is more than 0.1 %. d Directed graphs based on translation-uncoupled experiments (Fig. 4) for representing inter-dependent replication of the RNA clones of each selected round. Nodes represent RNA clones of indicated rounds. Arrows indicate direct replication with widths proportional to binary logarithm of the measured levels of relative replication. Gray dashed lines indicate undetected replication events from host RNA clones.

