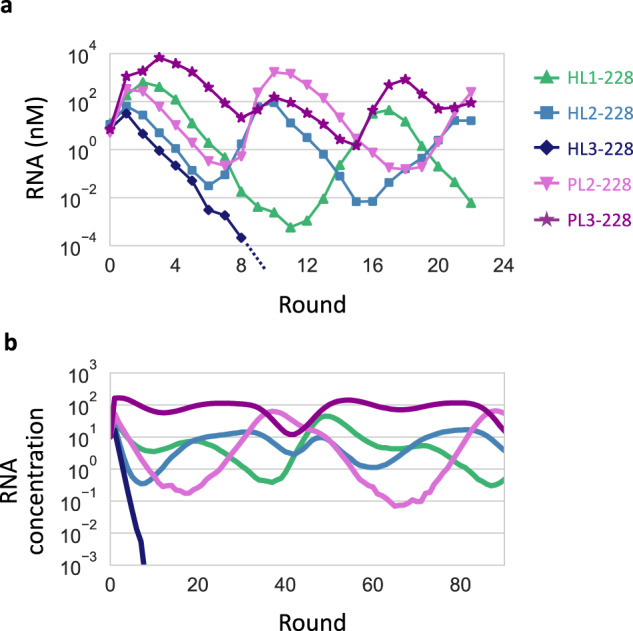
Fig. 5. Co-replication dynamics of the evolved RNA clones.

a RNA concentration changes in a long-term replication experiment started with 10 nM each of the five RNA clones at round 228, measured by sequence-specific RT-qPCR. b Representative RNA concentration changes in a simulated long-term replication using the theoretical model. The replication rates of the simulated RNAs were based on those of the RNA clones of the same colors in (a).
