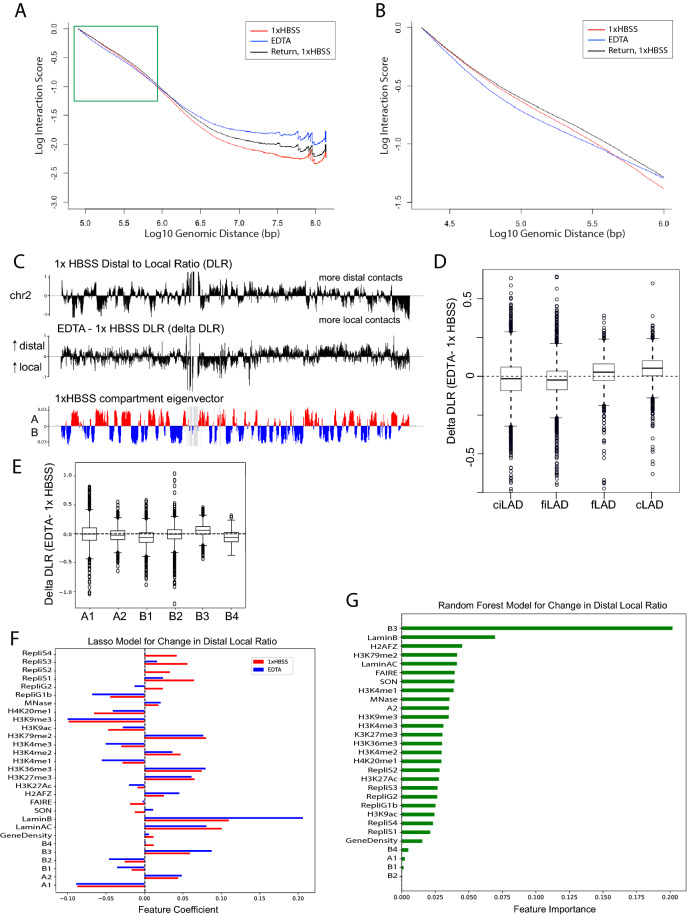
Figure 4.
Polymer scaling is altered reflecting chromatin fiber elongation during expansion. (A) Log10 interactions vs. Log10 of genomic distance in base pairs for all 40 kb binned intrachromosomal interactions genome wide. A faster drop in local interactions is seen at short distances in EDTA only (green box). (B) 10 kb resolution interaction scaling genome wide, zooming in to interactions within 1 Mb. (C) The distal to local ratio (DLR) was calculated as the sum of interactions greater than 3 Mb vs. less than 3 Mb for each 100 kb bin (top) and then the difference in DLR was calculated between EDTA and HBSS and median centered (middle). Regions of increased and decreased DLR visually correspond to B and A compartments (bottom). (D) Changes in DLR for the whole genome segregated by LAD status as classified by Kind et al.39 (cLAD = constitutive LAD, fLAD = facultative LAD, fiLAD = facultative interLAD, ciLAD = constitutive interLAD). (E) Changes in DLR for the whole genome segregated by subcompartment. (F) A ridge regression model was used to fit the DLR for both conditions at 100 kb resolution and the feature coefficients are shown (1xHBSS = red, EDTA = blue). (G) A random forest model was used to fit the change in DLR (EDTA—1× HBSS) at 100 kb resolution. Features are sorted by importance.

