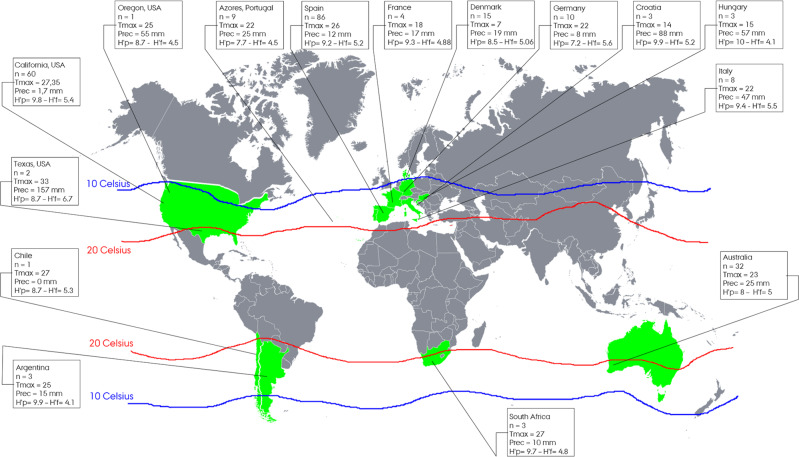
Fig. 1. Coverage of the study.
The countries highlighted in green are represented in the study’s dataset. The two isothermal lines define the range for optimal conditions for grapevine cultivation (isothermal source: https://www.thirtyfifty.co.uk/spotlight-climate-change.asp). Each panel shows the country, the number of samples (n) and information about the average maximum temperature (Tmax) and the level of precipitation (Prec) up to 2 weeks before sample collection. Finally, H′P and H′F define the Shannon Index for the prokaryotic and fungal community respectively.

