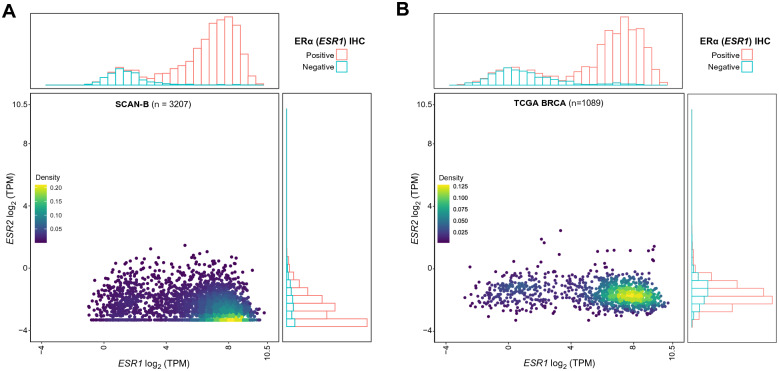
Figure 1 .
ESR1 and ESR2 mRNA expression in SCAN-B and TCGA data sets. (A) Scatterplot of ESR1 and ESR2 mRNA expression (log2TPM). ESR1 and ESR2 data points are colored by density using 2D kernel density estimation function from the MASS R package. Adjacent to the scatterplot, histograms are shown indicating the frequency of expression values and color-coded according to ERα clinical status. (B) Expression of ESR1 and ESR2 is shown for the TCGA dataset as in panel A.

