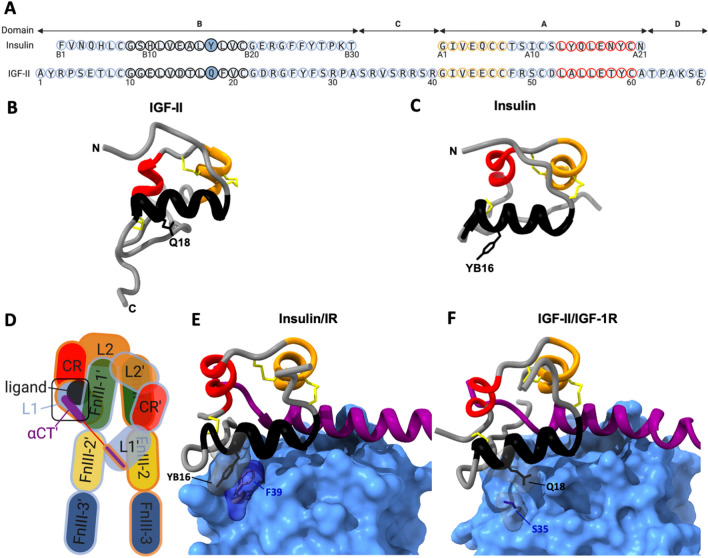
Figure 1.
Sequence and structural comparison of IGF-II and insulin. (A) Sequence alignment of IGF-II and insulin. Domains are indicated above. Each peptide has three alpha helices; B-chain helix 1 (black circles), A-chain helix 2 (orange circles) and A-chain helix 3 (red circles). Residue numbers are indicated below each sequence. Insulin YB16 and IGF-II Q18 residues are in solid filled circles. (B) IGF-II and (C) insulin ribbon structures (PDB: 1IGL and 1MSO respectively) show the three disulphide bonds and helices coloured as in (A). Side chains of YB16 in insulin and Q18 in IGF-II are shown. (D) Schematic diagram representing the IR and IGF-1R ligand bound extracellular domain structures. Individual αβ monomer outlines are coloured either blue or orange. Extracellular domains include the first and second leucine-rich repeat domains (L1 and L2), cysteine-rich domain (CR), first, second and third fibronectin type-III domains (FnIII-1, -2, and -3), insert domain (ID), α-chain C-terminal region (αCT). Transmembrane and intracellular domains, including the tyrosine kinase domain, are not shown. (E) Insulin and (F) IGF-II bound to site 1 of their cognate receptors, as highlighted with the black box in (D) (from PDB: 6HN5 and 6VWI, respectively). L1 domains are surface filled in cornflower blue, α-chain C-terminal regions (αCT) are coloured purple. The side chains of insulin residue YB16 and F39 of the IR L1 domain and the equivalent residues Q18 in IGF-II and S35 of the IGF-1R L1 domain are shown with transparent surface fill.

