Figure 7.
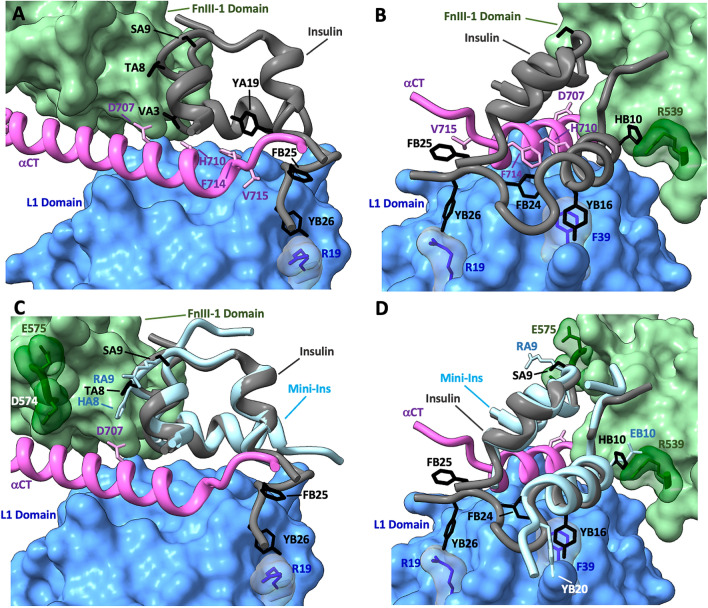
(A,B) CryoEM structure of insulin bound to the IR (PDB: 6HN5) highlighting the site 1 interaction. The surface filled L1 domain (cornflower blue) has residue R19 and F39 side chains shown (dark blue) and the αCT’ (purple) has residues H710, F714 and V715 side chains (light pink) depicted. The surface filled FnIII-1’ domain (light green) has R539 chain shown (dark green). Insulin binds to the IR primary binding site (αCT’ and L1 domain of opposite monomers), with key contacts involving insulin residues VA3, YA19 and FB25 with αCT’ resides H710, F714 and V715. Additionally, insulin residues FB24, FB25 and YB26 (FFY motif) contact residues R19 and YB16 of the L1 domain. An additional interaction is made between insulin residue HB10 and R539 of the FnIII-1’ domain. (C,D) CryoEM structure of insulin bound to the IR with mini-ins overlayed (PDB: 6HN5 and 6VET respectively). The lack of the FFY motif in mini-ins is compensated through GB20Y mutation which likely interacts with residue F39 of the L1 domain. The interaction with FnIII-1’ domain R539 is strengthened through a HB10E mutation and additional contacts are made through residue E575 and mini-ins residues SA9R and TA8H.

