
Fig. 2.
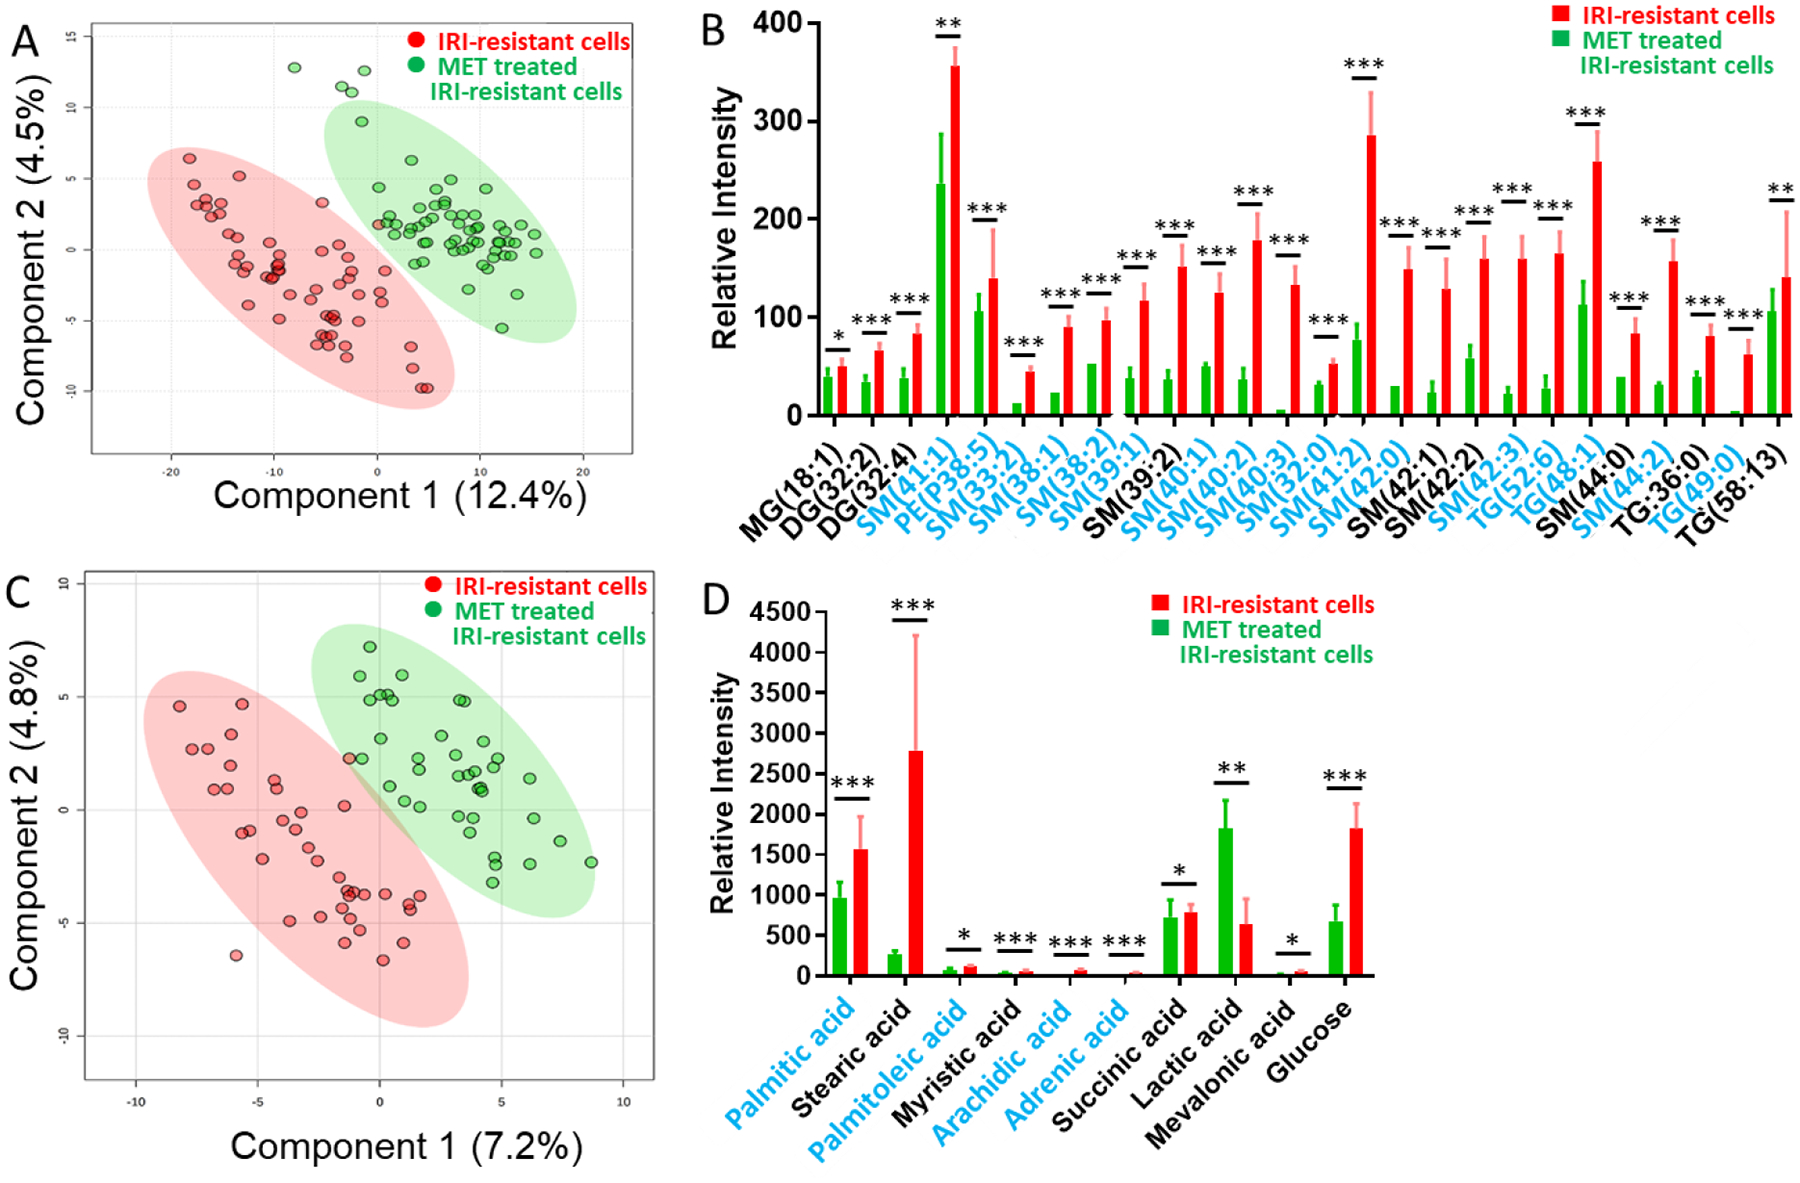
SCMS results revealing the influence of metformin (8.7 mM) mono-treatment on metabolites of IRI-resistant cells. (A) PLS-DA of positive ion mode results shows the metabolomics profiles were significantly changed (p = 0.009 from permutation test), and (B) representative lipids with significant abundance change (p < 0.05 from Student’s t-test). (C) PLS-DA of negative ion mode results shows the metabolomics profiles were significantly changed (p < 0.003 from permutation test), and (D) representative fatty acids with significant abundance change (* p < 0.05, ** p < 0.01, *** p < 0.001 from Student’s t-test). Species labeled in blue font were identified using MS2 analysis both from single cells and cell lysates. (MG: monoglycerides; DG: diglyceride; TG: triglyceride; PI: phosphatidylinositol; PS: Phosphatidylserine; SM: sphingomyelin).