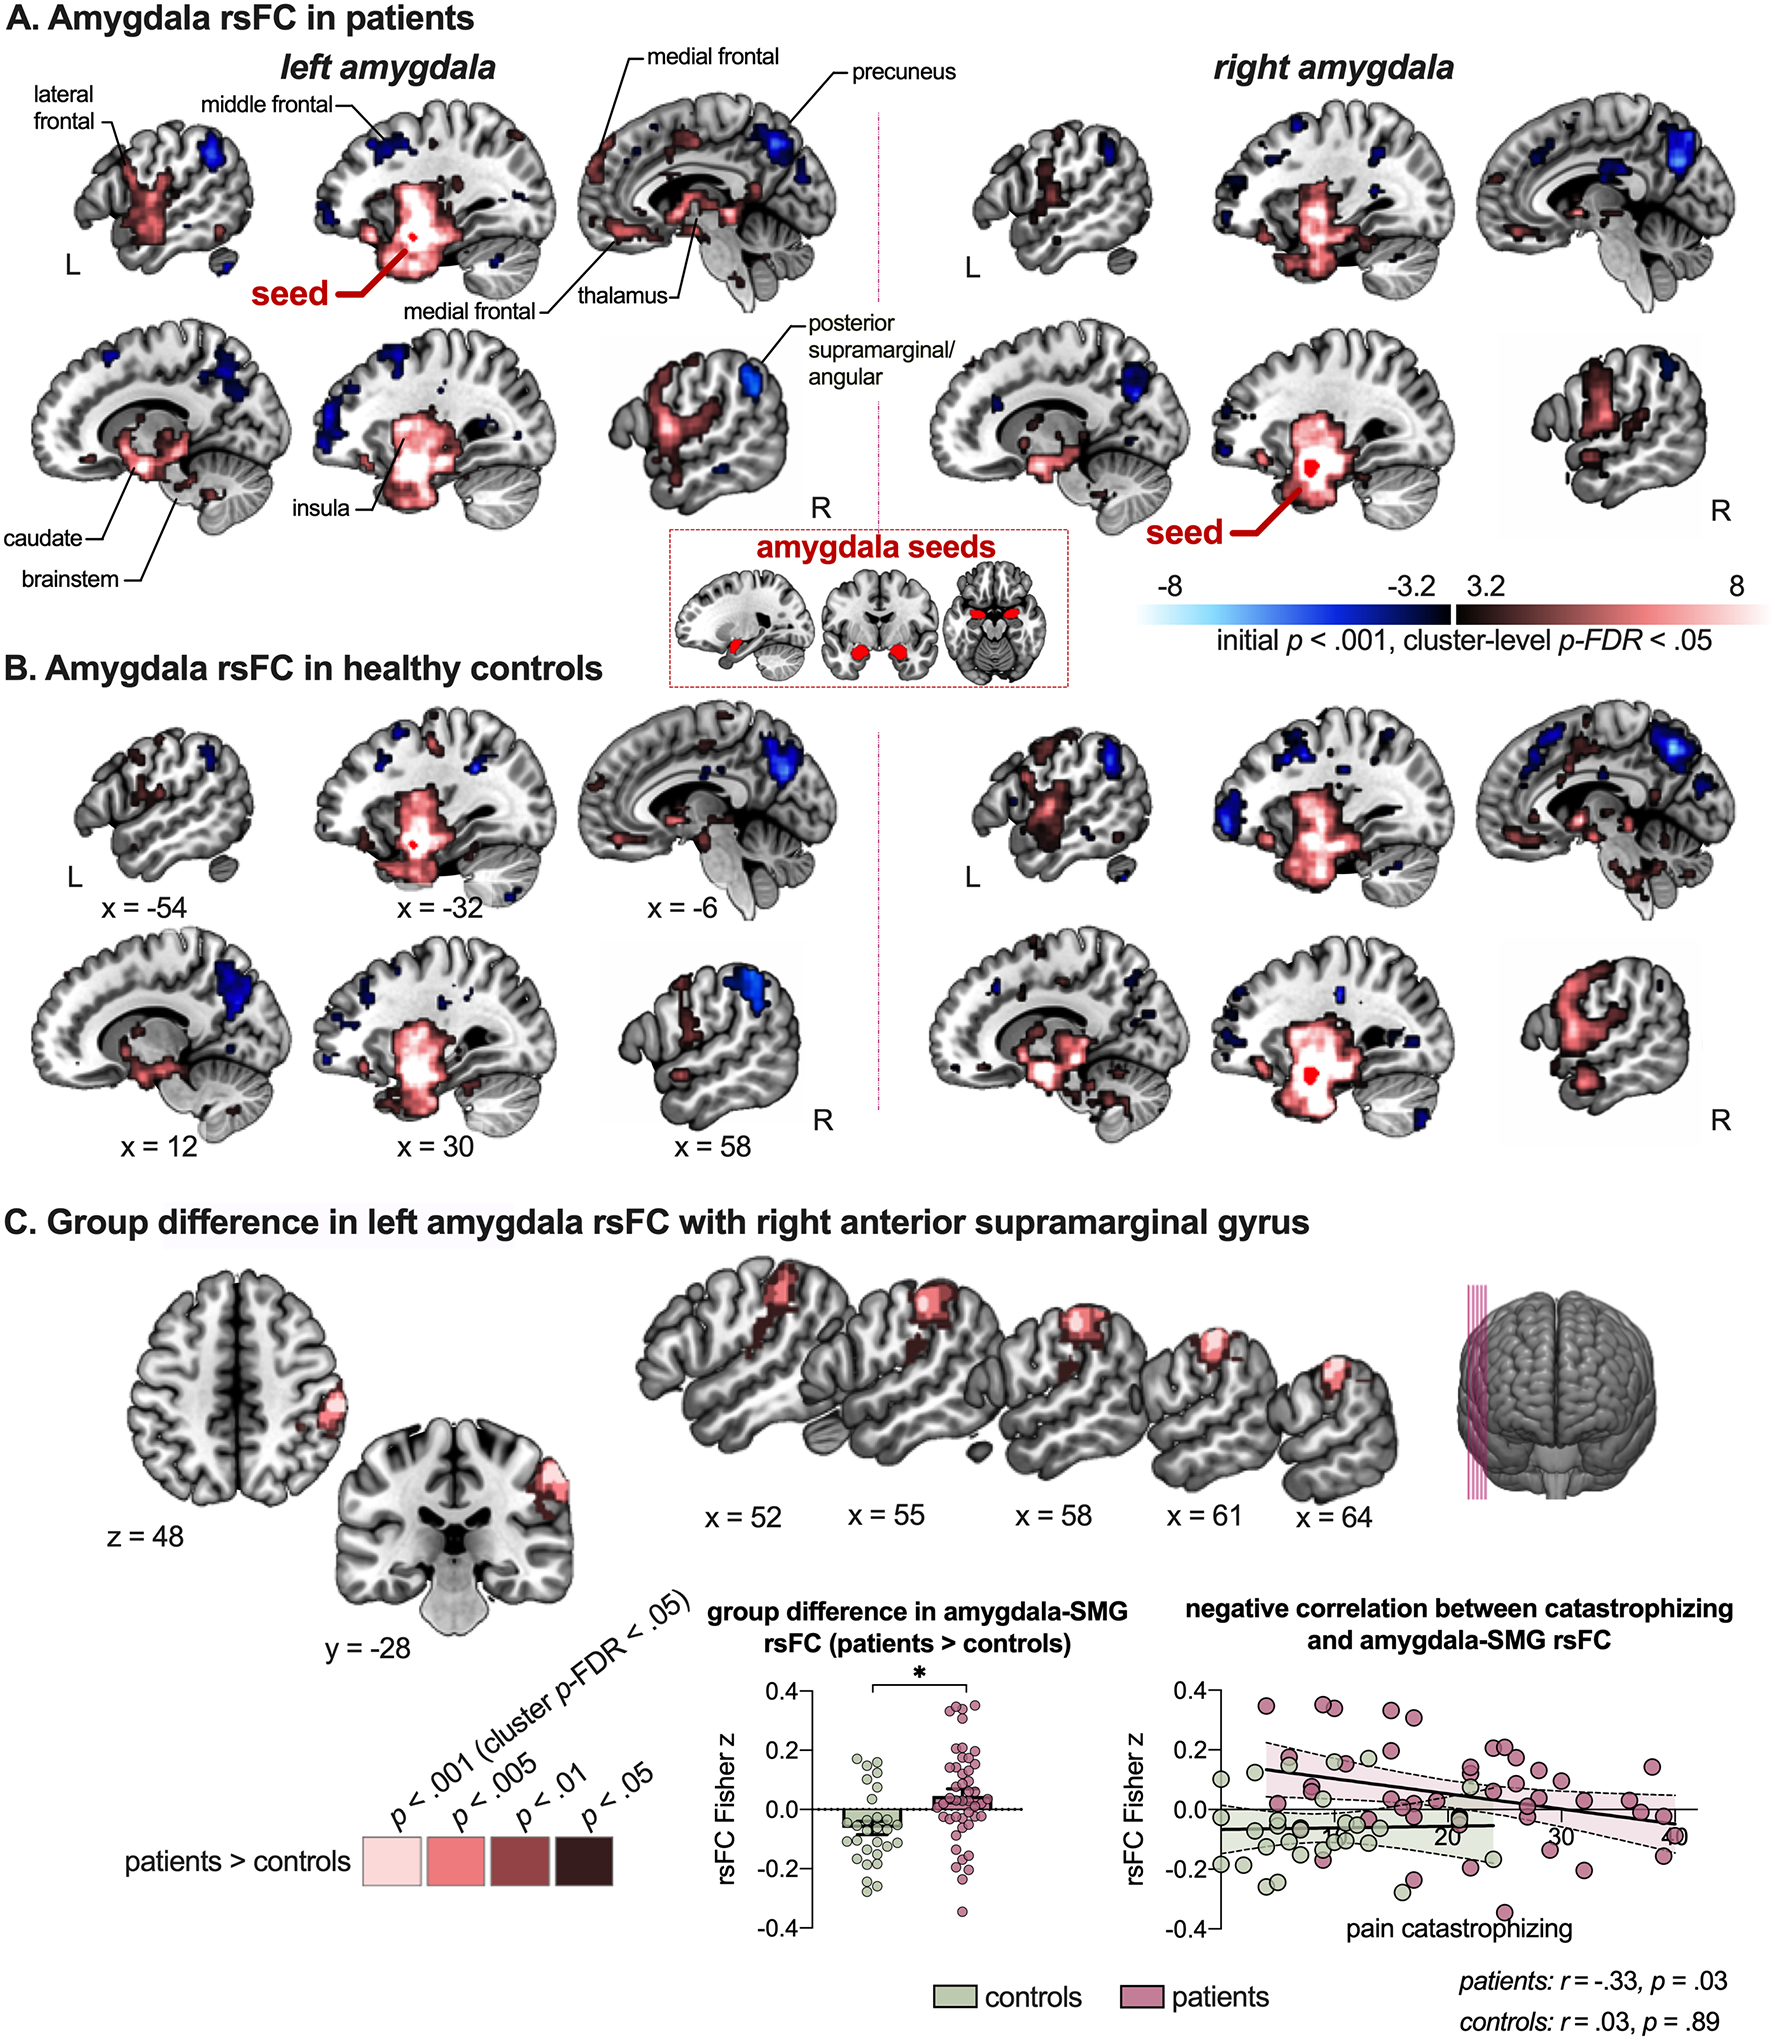
Figure 3. Amygdala rsFC across groups.

Maps depict left and right amygdala coupling with the rest of the brain, with the seed region overlaid (red) for patients (A) and controls (B). In C, the group difference (patients > controls) in left amygdala – right anterior supramarginal gyrus coupling is presented, including the anatomical reference, the connectivity values per group (showing enhanced rsFC in patients compared to controls) and the association with pain catastrophizing (showing negative correlation between catastrophizing and amygdala rsFC with supramarginal gyrus in the patient group). Note that labels mostly refer to peak coordinates, even though clusters may extend into other regions (see also Tables S2–S5). rsFC = resting-state functional connectivity; SMG = supramarginal gyrus. * depicts significant difference
