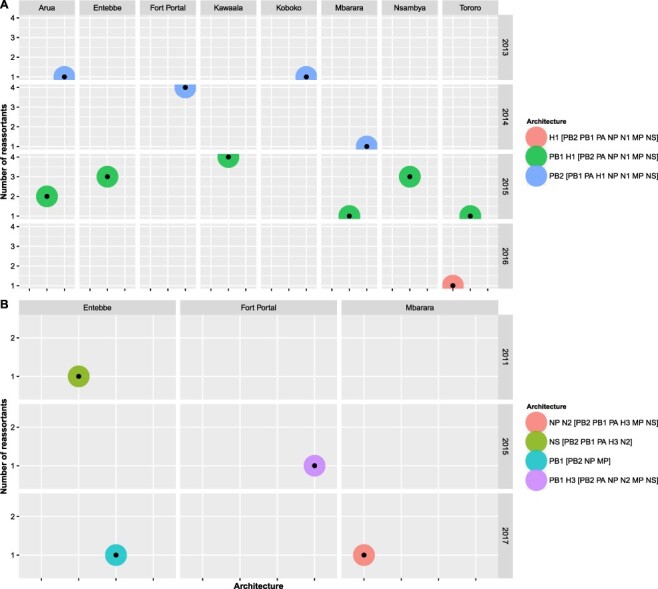
Figure 2.

Temporal and spatial distribution of reassortant influenza A viruses with different reassortment architecture in Uganda. Panel A shows the distribution of reassortants with different reassortment architecture among 100 Uganda H1N1pdm09 viruses sampled in 2010–18. Panel B shows the distribution of reassortants with different reassortment architecture observed among 93 Uganda H3N2 viruses sampled in 2010–17. Reassortants and the genes involved were identified using GiRaF software (Nagarajan and Kingsford 2011). Details on the number of Uganda H1N1pdm09 and H3N2 reassortants with a specific architecture per site per year are provided in Supplementary Tables S3 and S4, respectively.
