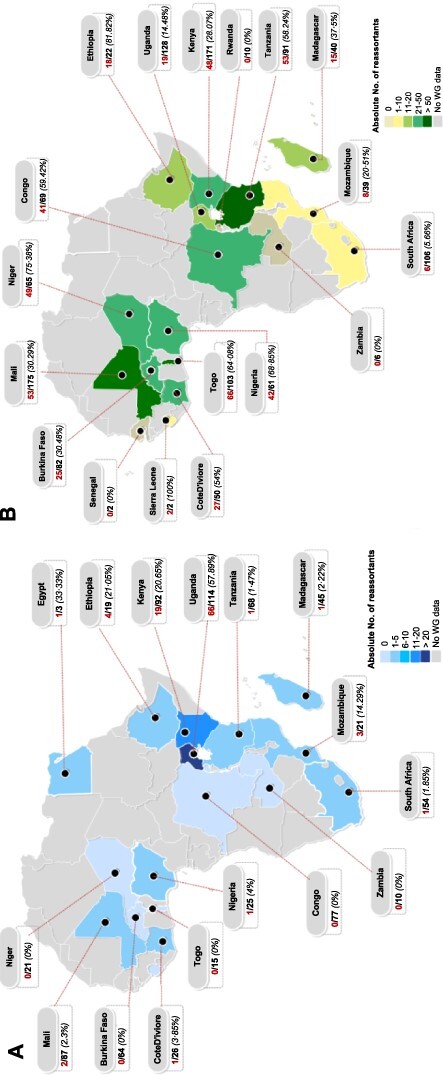
Figure 7.

Spatial distribution of influenza A virus reassortants across Africa. The numerator (red) is the absolute number of reassortants and the denominator (black) is the number of whole genomes sampled or analysed from a given country. Panel A shows the distribution of reassortant H1N1pdm09 viruses sampled between 2009 and 2020 in Africa. The number of H1N1pdm09 reassortants in Seychelles (n = 1) were not shown. Panel B shows the distribution of reassortant H3N2 viruses sampled between 1994 and 2020 in Africa. The frequency of reassortment per country is shown in (%). Countries are colour-coded based on the absolute number of reassortant viruses identified by GiRaF (Nagarajan and Kingsford 2011).
