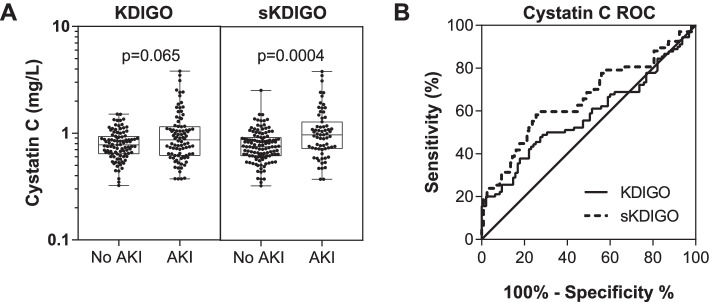
Fig. 3.
Comparison of Cystatin C levels based on the KDIGO AKI definition. A Box and whisker plots showing the median (interquartile range) and range of serum Cystatin C with the individual data points overlaid. Differences between groups were compared using Wilcoxon rank-sum test with the p values presented on the graphs. B Receiver operating characteristic (ROC) curve to measure the association between the biomarker level and AKI status. Serum Cystatin C had a higher area under the receiver operating characteristic (ROC) curve (AUROC) using sKDIGO compared to KDIGO

