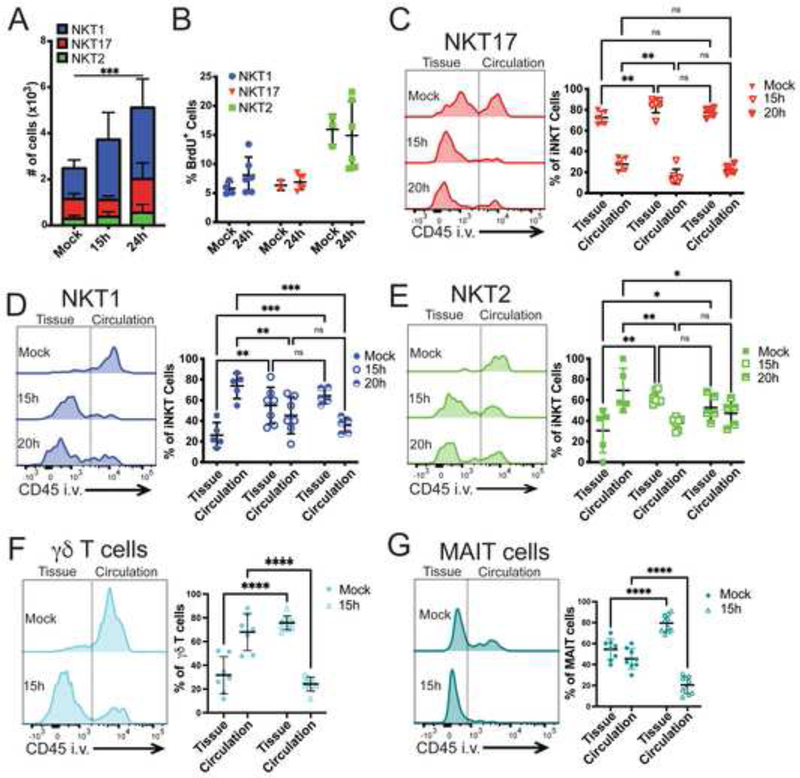
Figure 1: Innate-like T cells are recruited into the lung tissue after S. pneumoniae infection.
A) iNKT cell subset numbers in the lung before and after infection. N=7 mice per group, 2 independent experiments combined. Statistical significance was assessed via 2-way ANOVA, with Tukey’s multiple comparisons test. Source of variation: Interaction (*); Time (***), depicted in figure; Subset (****). NKT1 cells significantly expand at 15h (**) and 24h (****), Tukey’s multiple comparisons test. B) Percent of BrdU+ iNKT cell subsets in lung 24h after infection. N=6 mice per group, combined data from 2 independent experiments. C-G) Representative histograms and quantification of sub-tissue location of lung innate-like T cells, as determined by anti-CD45 antibody intravenous injection prior to tissue collection. Line separating tissue and circulation based on cell types from mice not injected with anti-CD45. Localization of NKT17 (C), NKT1 (D), and NKT2 (E); N=5–7 mice per group, combined data from 3 independent experiments. Statistical significance of NKT subset localization in Mock assessed via 2-way ANOVA, with Šídák’s multiple comparisons test. E &F) Sub-tissue location of lung γδ T cells (F) and MAIT cells (G); combination of 2 independent experiments, N=7–10 mice per group. Statistical significance assessed via 2-way ANOVA, with Šídák’s multiple comparisons test. See also Figure S1.

