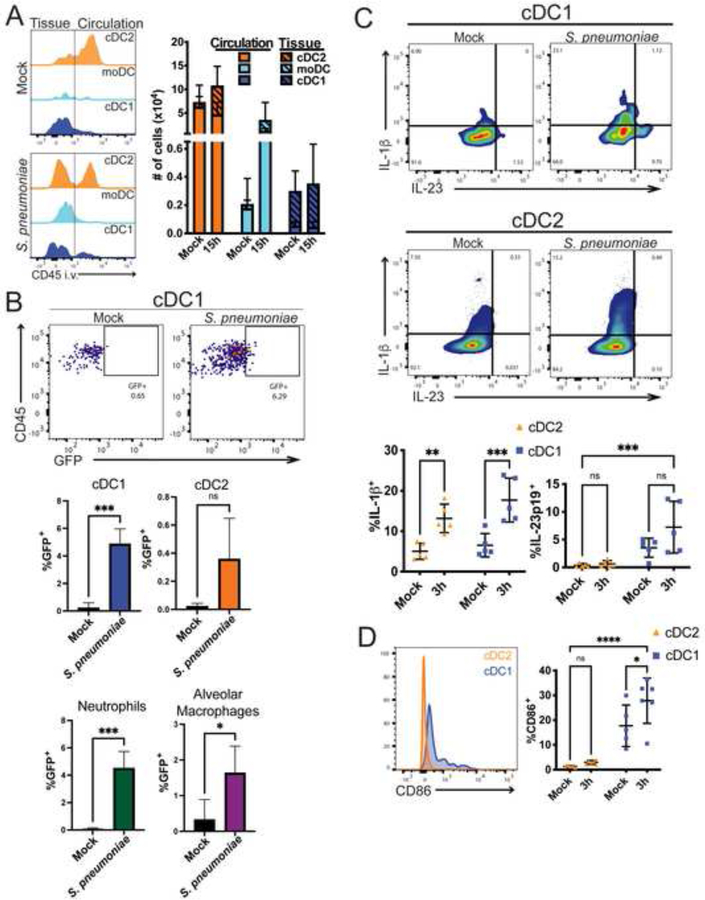
Figure 4: DC responses in the lung following infection.
A) Left: representative histograms of sub-tissue location of dendritic cell subtypes at 0 and 15 hours after infection. Line depicting tissue vs. circulatory localization drawn based on each cell type from mice not injected with anti-CD45. Right: Quantification of cells in tissue (hashed bars) and circulation (open bars) at 0 and 15 hours after infection. N=11–15 mice per group, 4 independent experiments combined. B) Mice were infected with GFP-expressing URF918 and euthanized 2 hpi. Bacterial uptake by lung APCs was assessed via flow cytometry. Top: Representative flow cytometry of cDC1. Bottom: Quantification. N=3–6 mice per group, combined from 3 independent experiments; statistical significance assessed via unpaired t test. C) Representative flow cytometry plot of cytokine production by lung cDC1 and cDC2 cells 3 hpi with URF918. Quantification below. Statistical significance was assessed via 2-way ANOVA, with Šídák’s multiple comparisons test. D. CD86 expression by cDC1 and cDC2 cells 3 hpi with URF918. Quantification on right. D & E. N = 5 mice per group, 2 independent experiments. Statistical significance was assessed via 2-way ANOVA, with Šídák’s multiple comparisons test. See also Figure S4.

