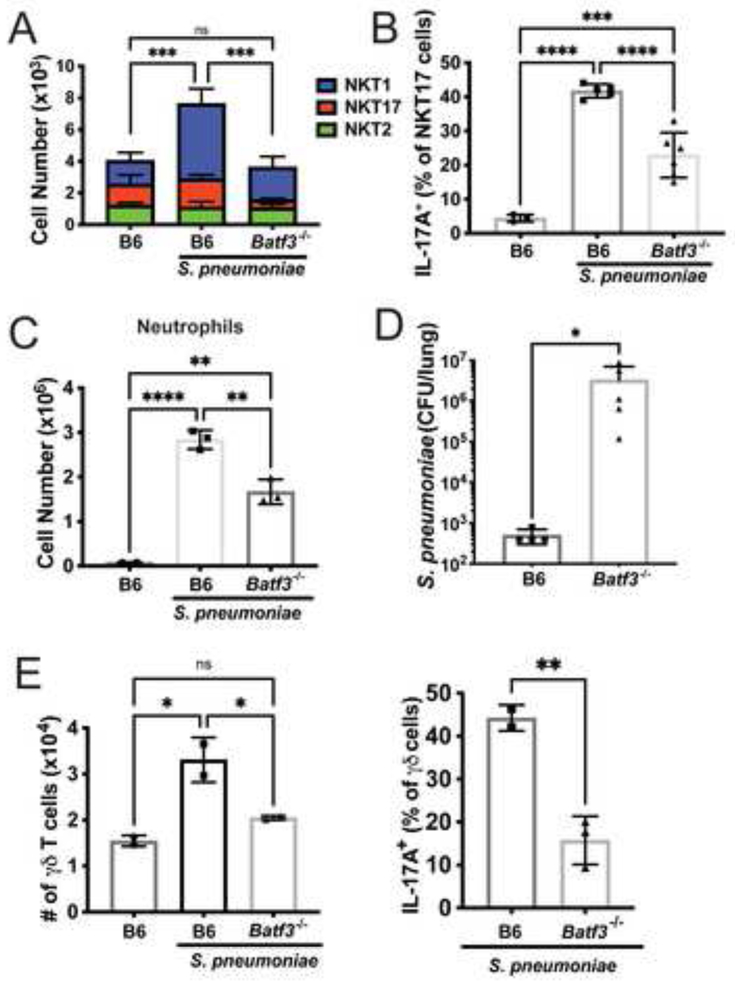
Figure 5: Batf3−/− mice have reduced innate-like T cell responses.
A) iNKT cell numbers at 15 hours after infection in C57BL/6J and Batf3−/− mice. N=6 per group. ***p<0.001, One-way ANOVA, with Tukey’s multiple comparisons. B) IL-17A production by NKT17 cells at 15 hours after infection. N=6 per group, ***p=.0004, ****p<0.0001 (One-way ANOVA with Tukey’s multiple comparisons). C) Lung neutrophil numbers at 15 hours after infection. N=6 per group. ****p<0.0001 (One-way ANOVA with Tukey’s multiple comparisons). D) Bacterial loads at 2 days. N=5 per group, *p=0.0159 (Mann-Whitney Test). E) γδ T cells numbers (left) and IL-17A production (right) at 15 hours after infection in C57BL/6J and Batf3−/− mice. N=2–3 mice per group, 1 experiment. Left: One-way ANOVA with Tukey’s multiple comparisons; Right: ** p= 0.0078, unpaired t test.

