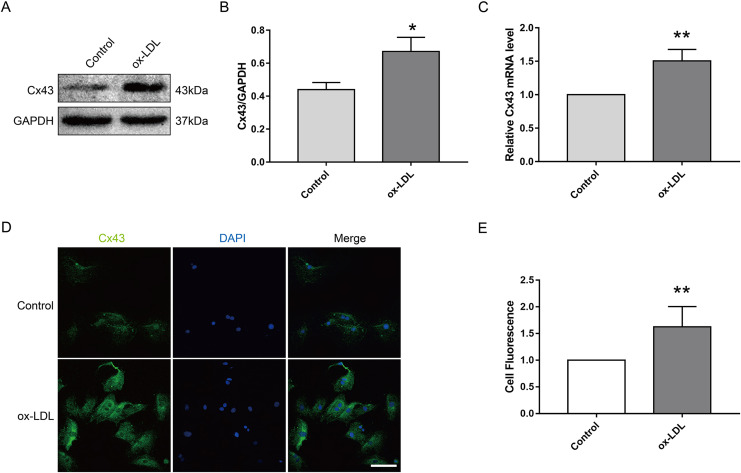
Figure 2. The effect of ox-LDL on the expression and localization of Cx43 in VSMCs.
(A and B) Immunoblot analysis of Cx43 on ox-LDL-treated (80 μg/ml, 24 h) VSMC. (C) qRT-PCR analysis for Cx43 mRNA levels in VSMC. (D and E) Immunofluorescence analysis of Cx43 (green), DAPI (blue) staining of the nucleus. Scale bar = 50 μm. (*P < 0.05 vs. Control, **P < 0.01 vs. Control, n = 3, data shown as the mean ± SD).

