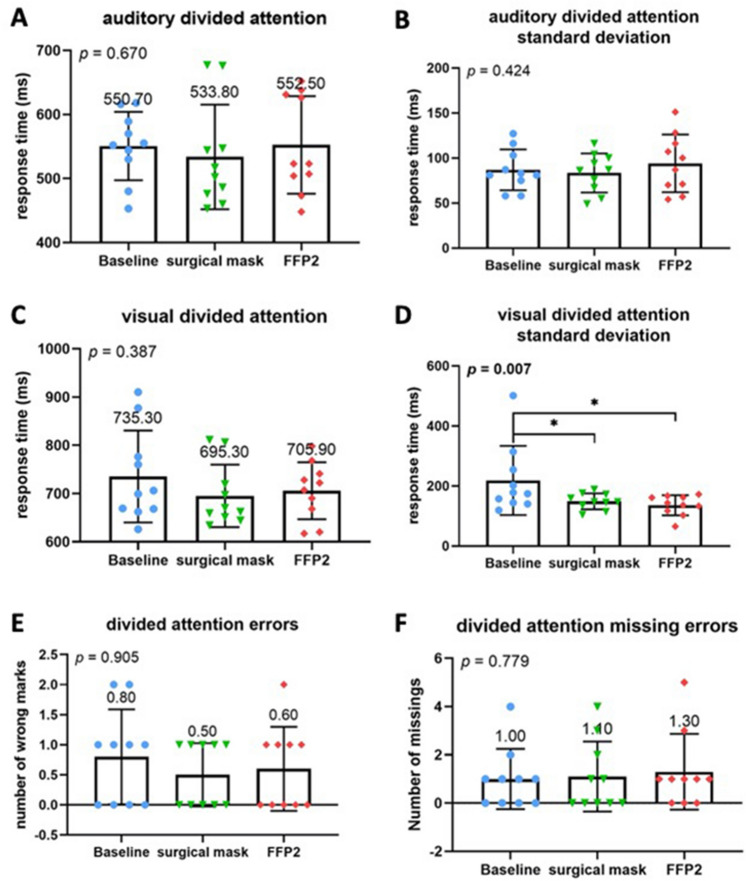
Fig. 4.
Test of attentional performance—subtest divided attention. Comparison of response times in milliseconds between the three investigated groups at baseline, operating with surgical mask, and operating with FFP2 mask in the test results. A Auditory divided attention reaction time, B standard deviation of auditory divided attention reaction time, C visual divided attention reaction time, D standard deviation of visual divided attention reaction time. E Comparison of number of errors made during performance of the divided attention test. F Comparison of number of missing errors made during performance of the divided attention test

