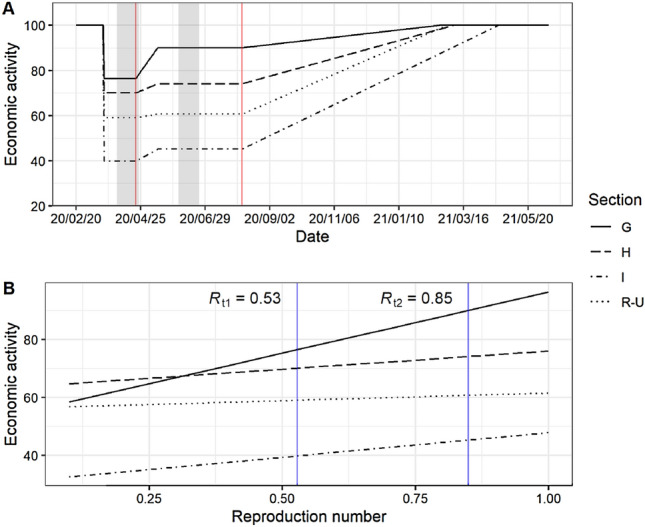
Fig. 3.

A The process of economic activity for the scenario where the policy-makers increase from 0.53 to 0.85. Starting from the pre-shutdown level (normalized to 100), the economy experiences a decline in activity during the shutdown. On April 20, the policy-makers initiated a gradual lifting of NPIs (indicated with the first vertical red line). After the 300 daily new cases have been reached, the measures are lifted and the economy enters the recovery phase (indicated with the second vertical red line). The beginning of the recovery phase depends on the value and the associated time period in Fig. 2B). Depicted are the activity levels for the economic sections G (wholesale and retail trade), H (transportation and storage), I (accommodation and food service activities), and R to U (entertainment and other service activities). The shaded grey areas indicate the survey periods for the ifo Business Survey in April and June. A more in-depth description of the model can be found in the supplement (see Fig. S4). B The linear relationships between changes in industry-specific economic activity and changes in the reproduction number. The vertical blue lines indicate the values 0.53 and 0.85 that are used to estimate the slope
