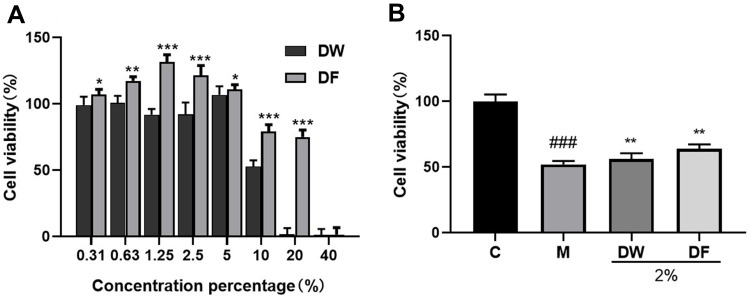
Figure 5.
Effects of DF on HaCaT Cell Viability. (A) Effects of Different Concentrations of DF and DW on Cell Viability; (B) Reparative Effects of DF and DW at 2% Concentration on Cells. (*P < 0.05, **P < 0.01, ***P < 0.001, versus the control group; ###P < 0.001, versus the control group. C: Control group; M: UVB irradiation model group).

