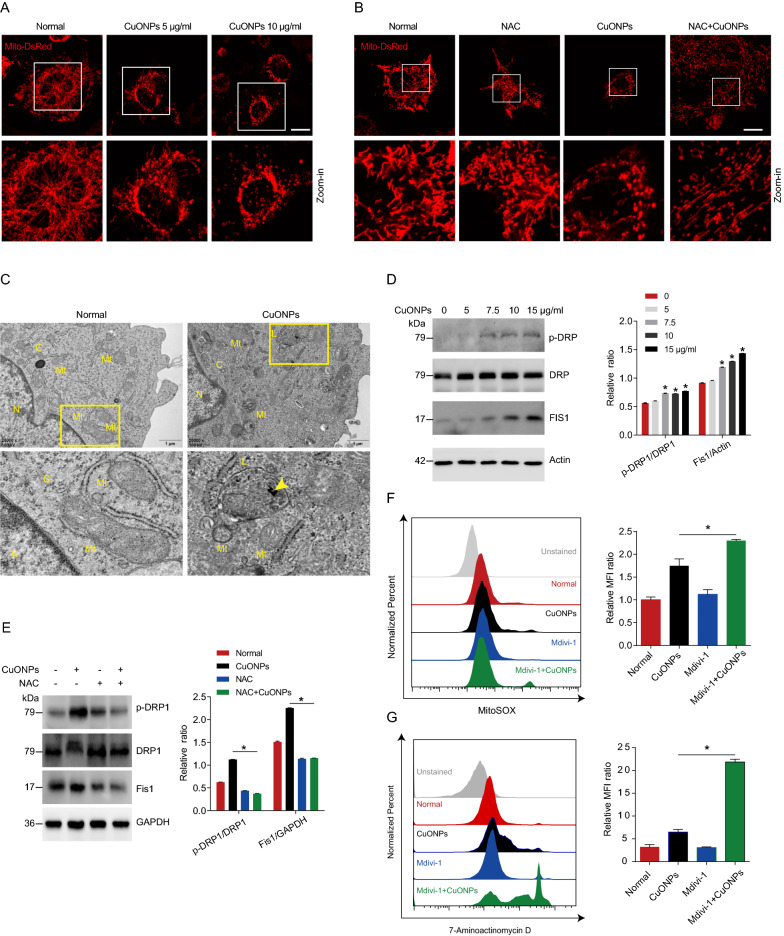
Fig. 1.
CuONPs induced disturbance of mitochondrial dynamics. A Representative fluorescence images of the stable EA.hy926 cell lines expressing Mito-DsRed after treatment with low or high dose CuONPs (5 and 10 μg/ml, respectively) for 12 h. Scale bars, 20 μm. B Representative fluorescence images of Mito-DsRed cells which were pretreated with NAC (10 mM) and then treated with CuONPs (10 μg/ml). Scale bars, 20 μm. C Representative TEM images of EA.hy926 cells after treatment with CuONPs for 12 h. N, nucleus; C, cytoplasm; Mt, mitochondria; L, lysosomes. Yellow arrow indicates uptaked CuONPs. D Western blotting analysis and quantification of the protein levels of p-DRP1, DRP and Fis1 in EA.hy926 treated with 0, 5, 7.5, 10 and 15 μg/ml CuONPs for 12 h, respectively. Actin was served as internal control. E Western blotting analysis and quantification of the protein levels of p-DRP1, DRP and Fis1 in EA.hy926 treated with NAC (10 mM) and CuONPs (10 μg/ml). GAPDH was used as internal control. F Representative FCM results of EA.hy926 cells after MitoSOX staining. The cells were pretreated with or without Mdivi-1 (25 μM) for 1 h, and then were treated with CuONPs (10 μg/ml) for 12 h. MFI, mean fluorescence intensity. G Representative FCM results of EA.hy926 cells after 7-Aminoactinomycin D (7-AAD) staining. In D, two-tailed unpaired Student’s t test was performed for statistical analysis. In E, F and G, one-way ANOVA with Tukey’s test was used for multiple comparisons. Results are representative of at least three independent experiments. Data are mean ± S.D. *p < 0.05

