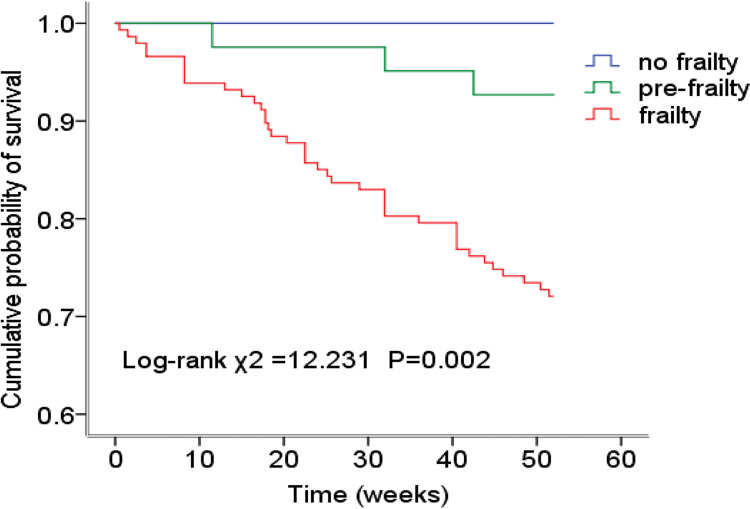
Figure 4.
Time to death. Kaplan-Meier plot of the association between frailty and survival. The pairwise comparison showed that there were significant differences between the frailty group and no frailty group (Log Rank χ2=7.256, P=0.007), frailty group and pre-frailty group (Log Rank χ2=5.238, P=0.022), respectively. No significant difference between the no frailty group and pre-frailty (Log Rank χ2=1.200, P=0.273).

