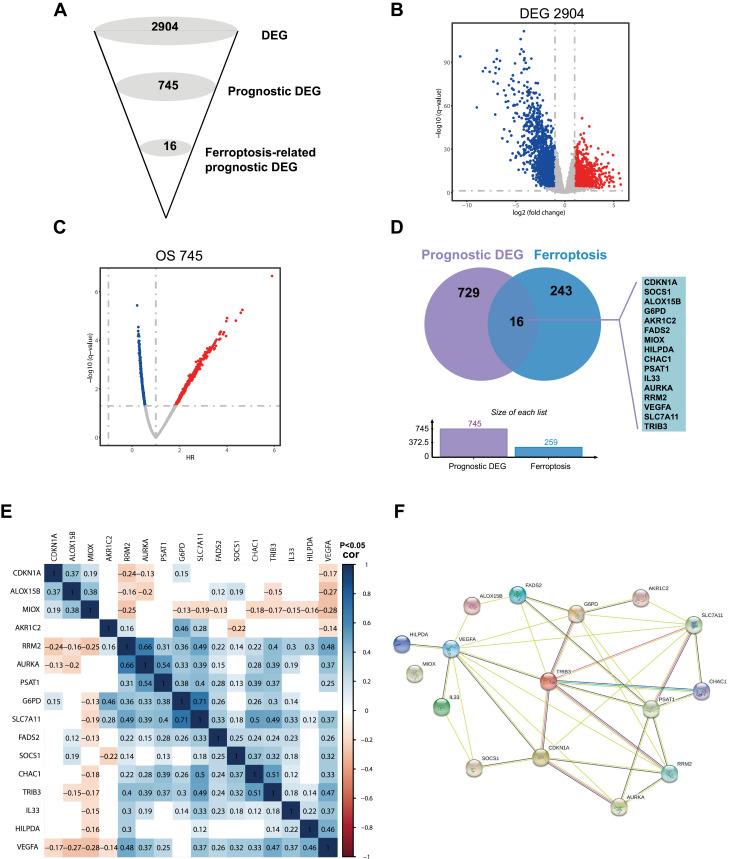
Figure 2.
Identification of the candidate ferroptosis-related genes in PRCC. (A) Schematic description of the filtering process for identification of ferroptosis-related candidates. (B) Identified differentially expressed genes (DEG) between tumor and normal tissues, screening threshold (p<0.001, fold change>1). (C) Identified DEG that were related to prognosis, screening threshold (p<0.05). (D) Venn diagram to identify ferroptosis-related prognostic DEG. (E) the correlation of the candidate genes of ferroptosis-related prognostic DEG. (F) STRING database analysis the interactions among the candidate genes.

