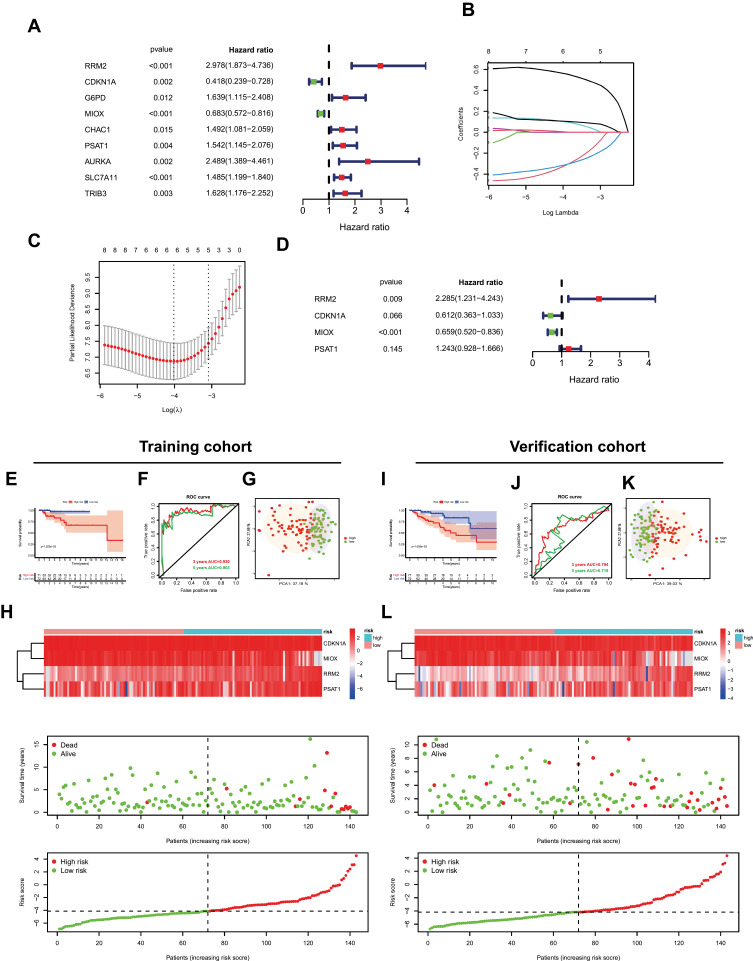
Figure 3.
Establishment of ferroptosis signature. (A) The univariate Cox regression analysis between gene expression and overall survival (OS). (B and C) LASSO Cox regression analysis of ferroptosis-related prognostic DEG. (D) Multivariate Cox regression analysis of ferroptosis signature. (E and I) The survival status in two cohorts. (F and J) Receiver operating characteristic (ROC) curve analysis in two cohorts. (G and K) Principal components analysis (PCA) analysis in two cohorts. (H and L) The heatmap of ferroptosis signature after risk score grouping, the distribution of OS status, and the distribution of risk score.

