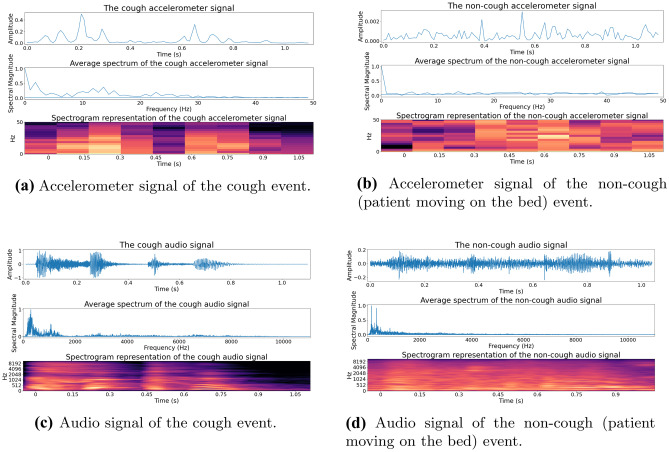
Figure 3.
Spectrogram representation of the cough and non-cough events shown in Fig. 2: The cough event is shown in (a) and (c) and the non-cough event (patient moving on the bed) in (b) and (d). The accelerometer and audio signals are shown in (a) & (b) and (c) & (d) respectively. The audio signal has a higher sampling rate and thus contains more frequency and time-domain information than accelerometer measurements.

