
FIG. 3.
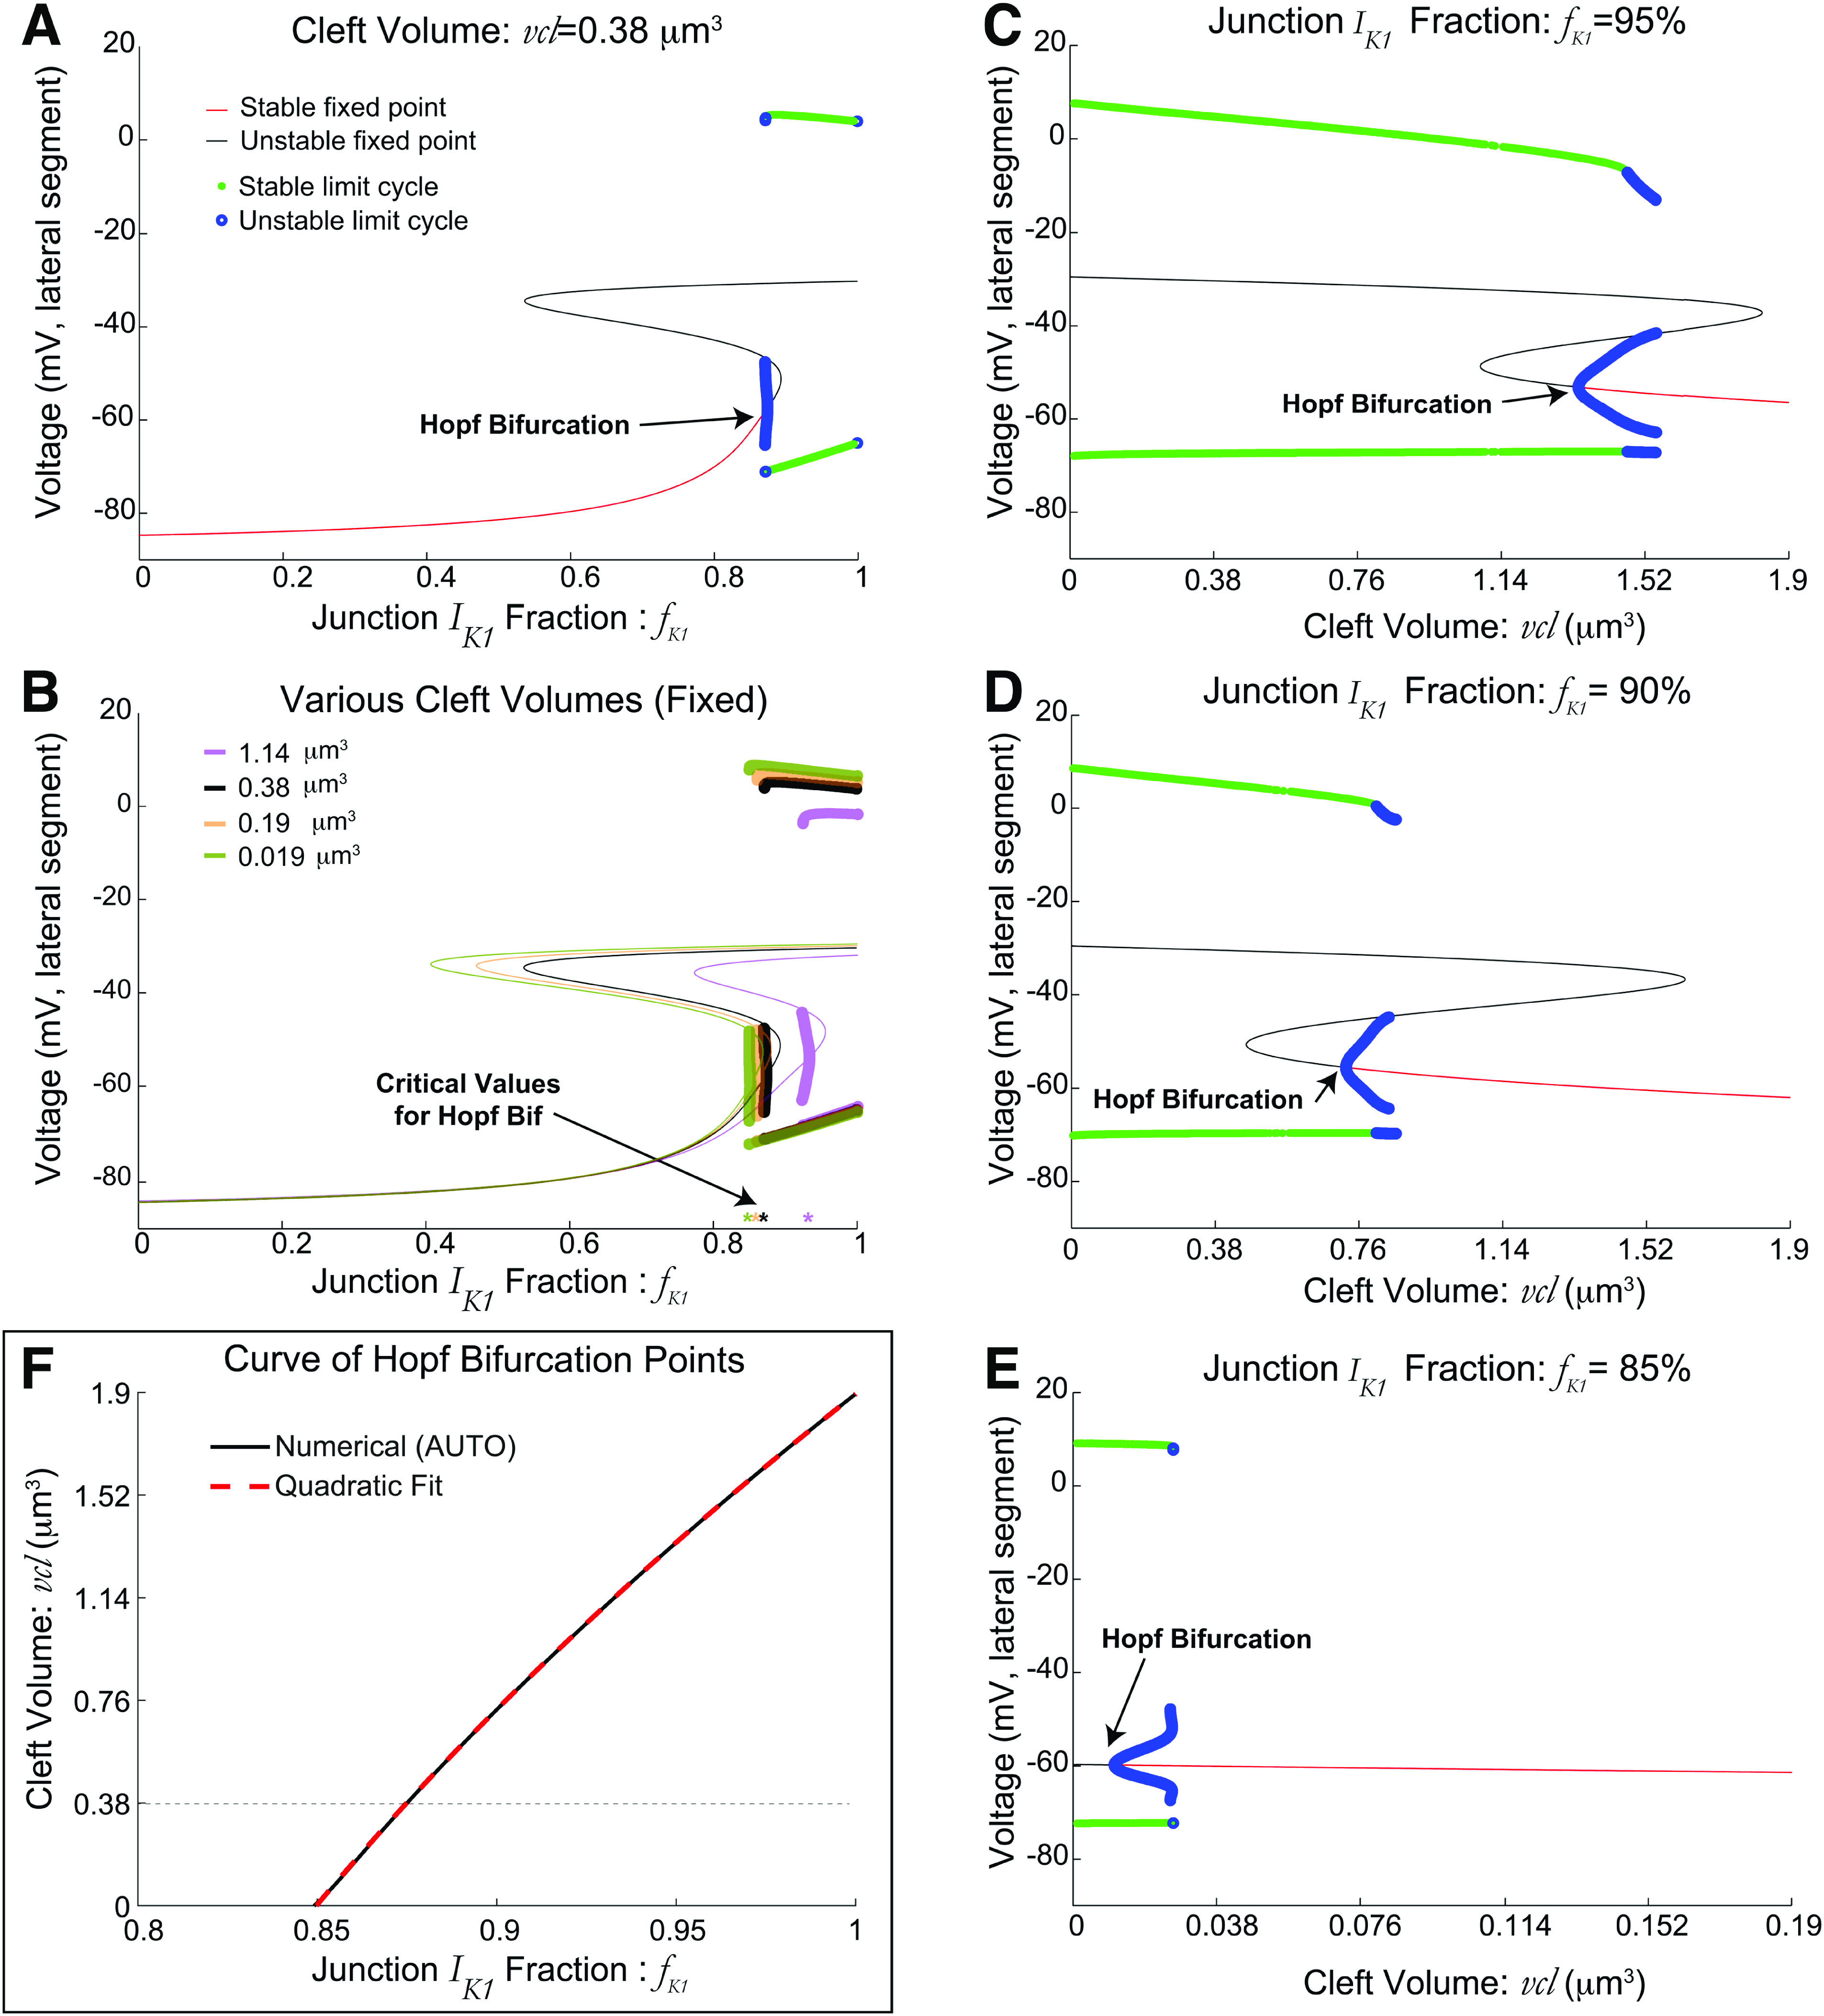
Dynamics of two identical cells with ephaptic coupling only, varying fraction of junctional membranes current, . Increasing leads to automaticity. (a) Bifurcation diagram for the voltage (lateral segment) vs , illustrating regimes of stable (red) and unstable (black) fixed points, and stable (red) and unstable (blue) limit cycles. (b) Bifurcation diagrams with various (fixed) cleft volumes , with all fixed points and limit cycles shown with a single color to illustrate how Hopf bifurcation point varies. (c)–(f) Bifurcation diagrams with fixed values (0.95, 0.9, 0.85, respectively), varying cleft volume . Decreasing the cleft volume leads to automaticity via a Hopf bifurcation. The critical volume decreases as decreases. (f) Summary: two-parameter curve of Hopf bifurcation points computed by XPP-AUTO (black)29,30 is well-fit by a quadratic function: . Note that automaticity occurs in the lower right triangular region of parameter space. Dashed black horizontal line corresponds with value in (a).