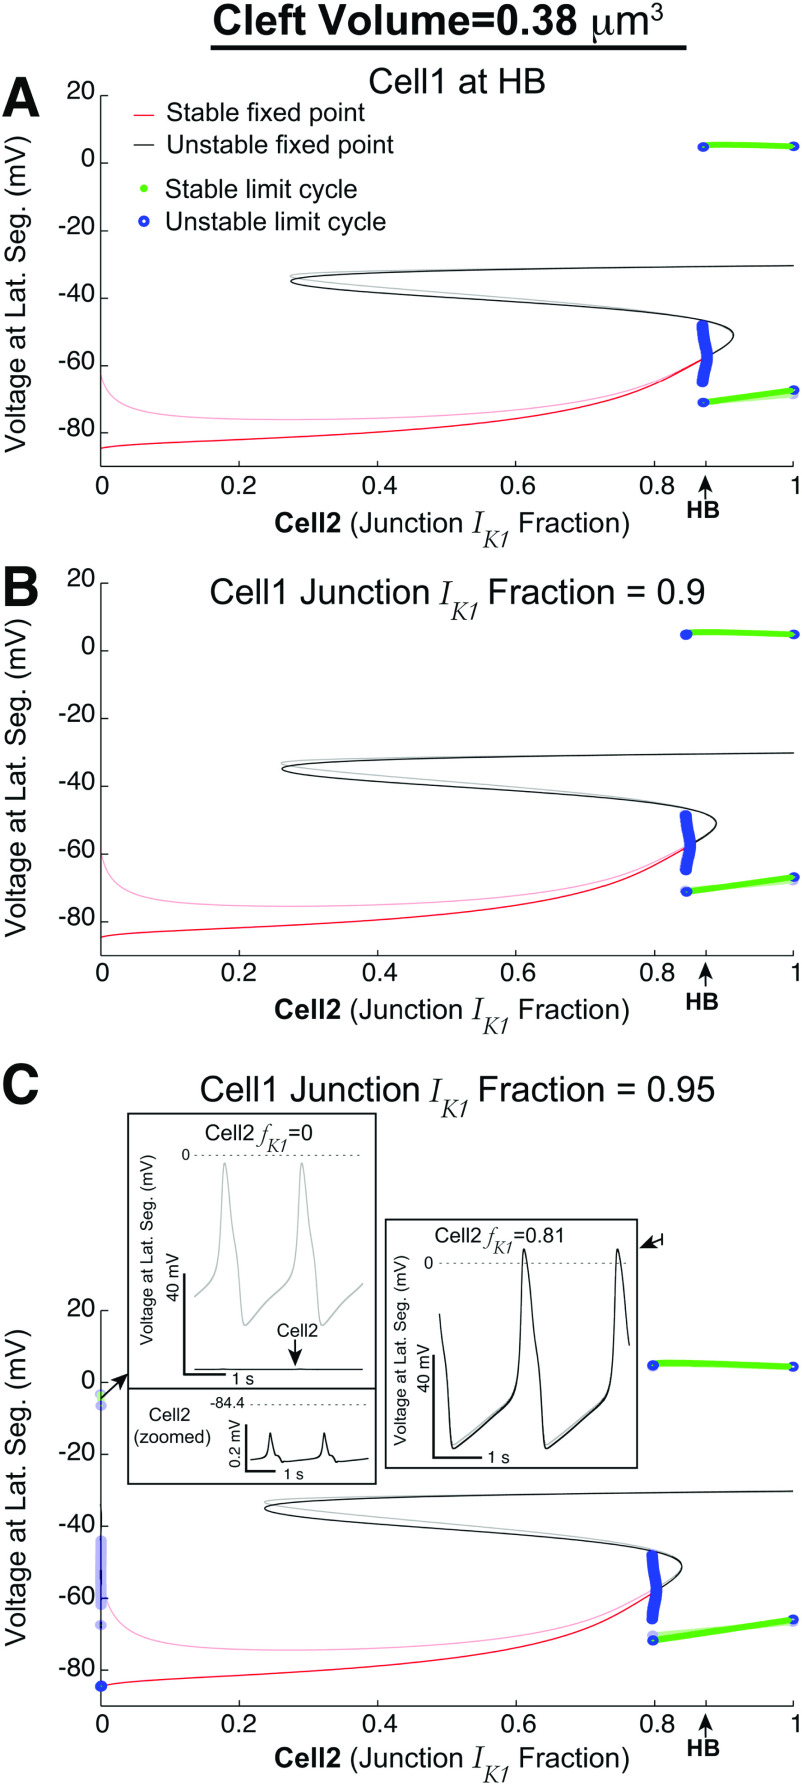
FIG. 6.
Detailed bifurcation diagrams for heterogeneous cells, with only ephaptic coupling. The transparent curves are lateral segment voltages in cell-1, and opaque curves are for cell-2. Ephaptic coupling can induce cell-2 to trigger APs in regimes for which, without ephaptic coupling, cell-2 would be quiescent. (a) With cell-1’s fraction of current ( ) at HB, cell-2’s fraction ( ) can be slightly less than HB for both cells to trigger APs. (b) For values larger than HB (0.9), the range for which both cells emit APs is larger. (c) For even larger (0.95), the dynamics are similar as in (b); however, for very small , there is a regime for which cell-1 triggers APs because it is essentially decoupled from cell-2, while cell-2 exhibits sub-threshold oscillations. For other cleft volumes , see Fig. 7(d).

