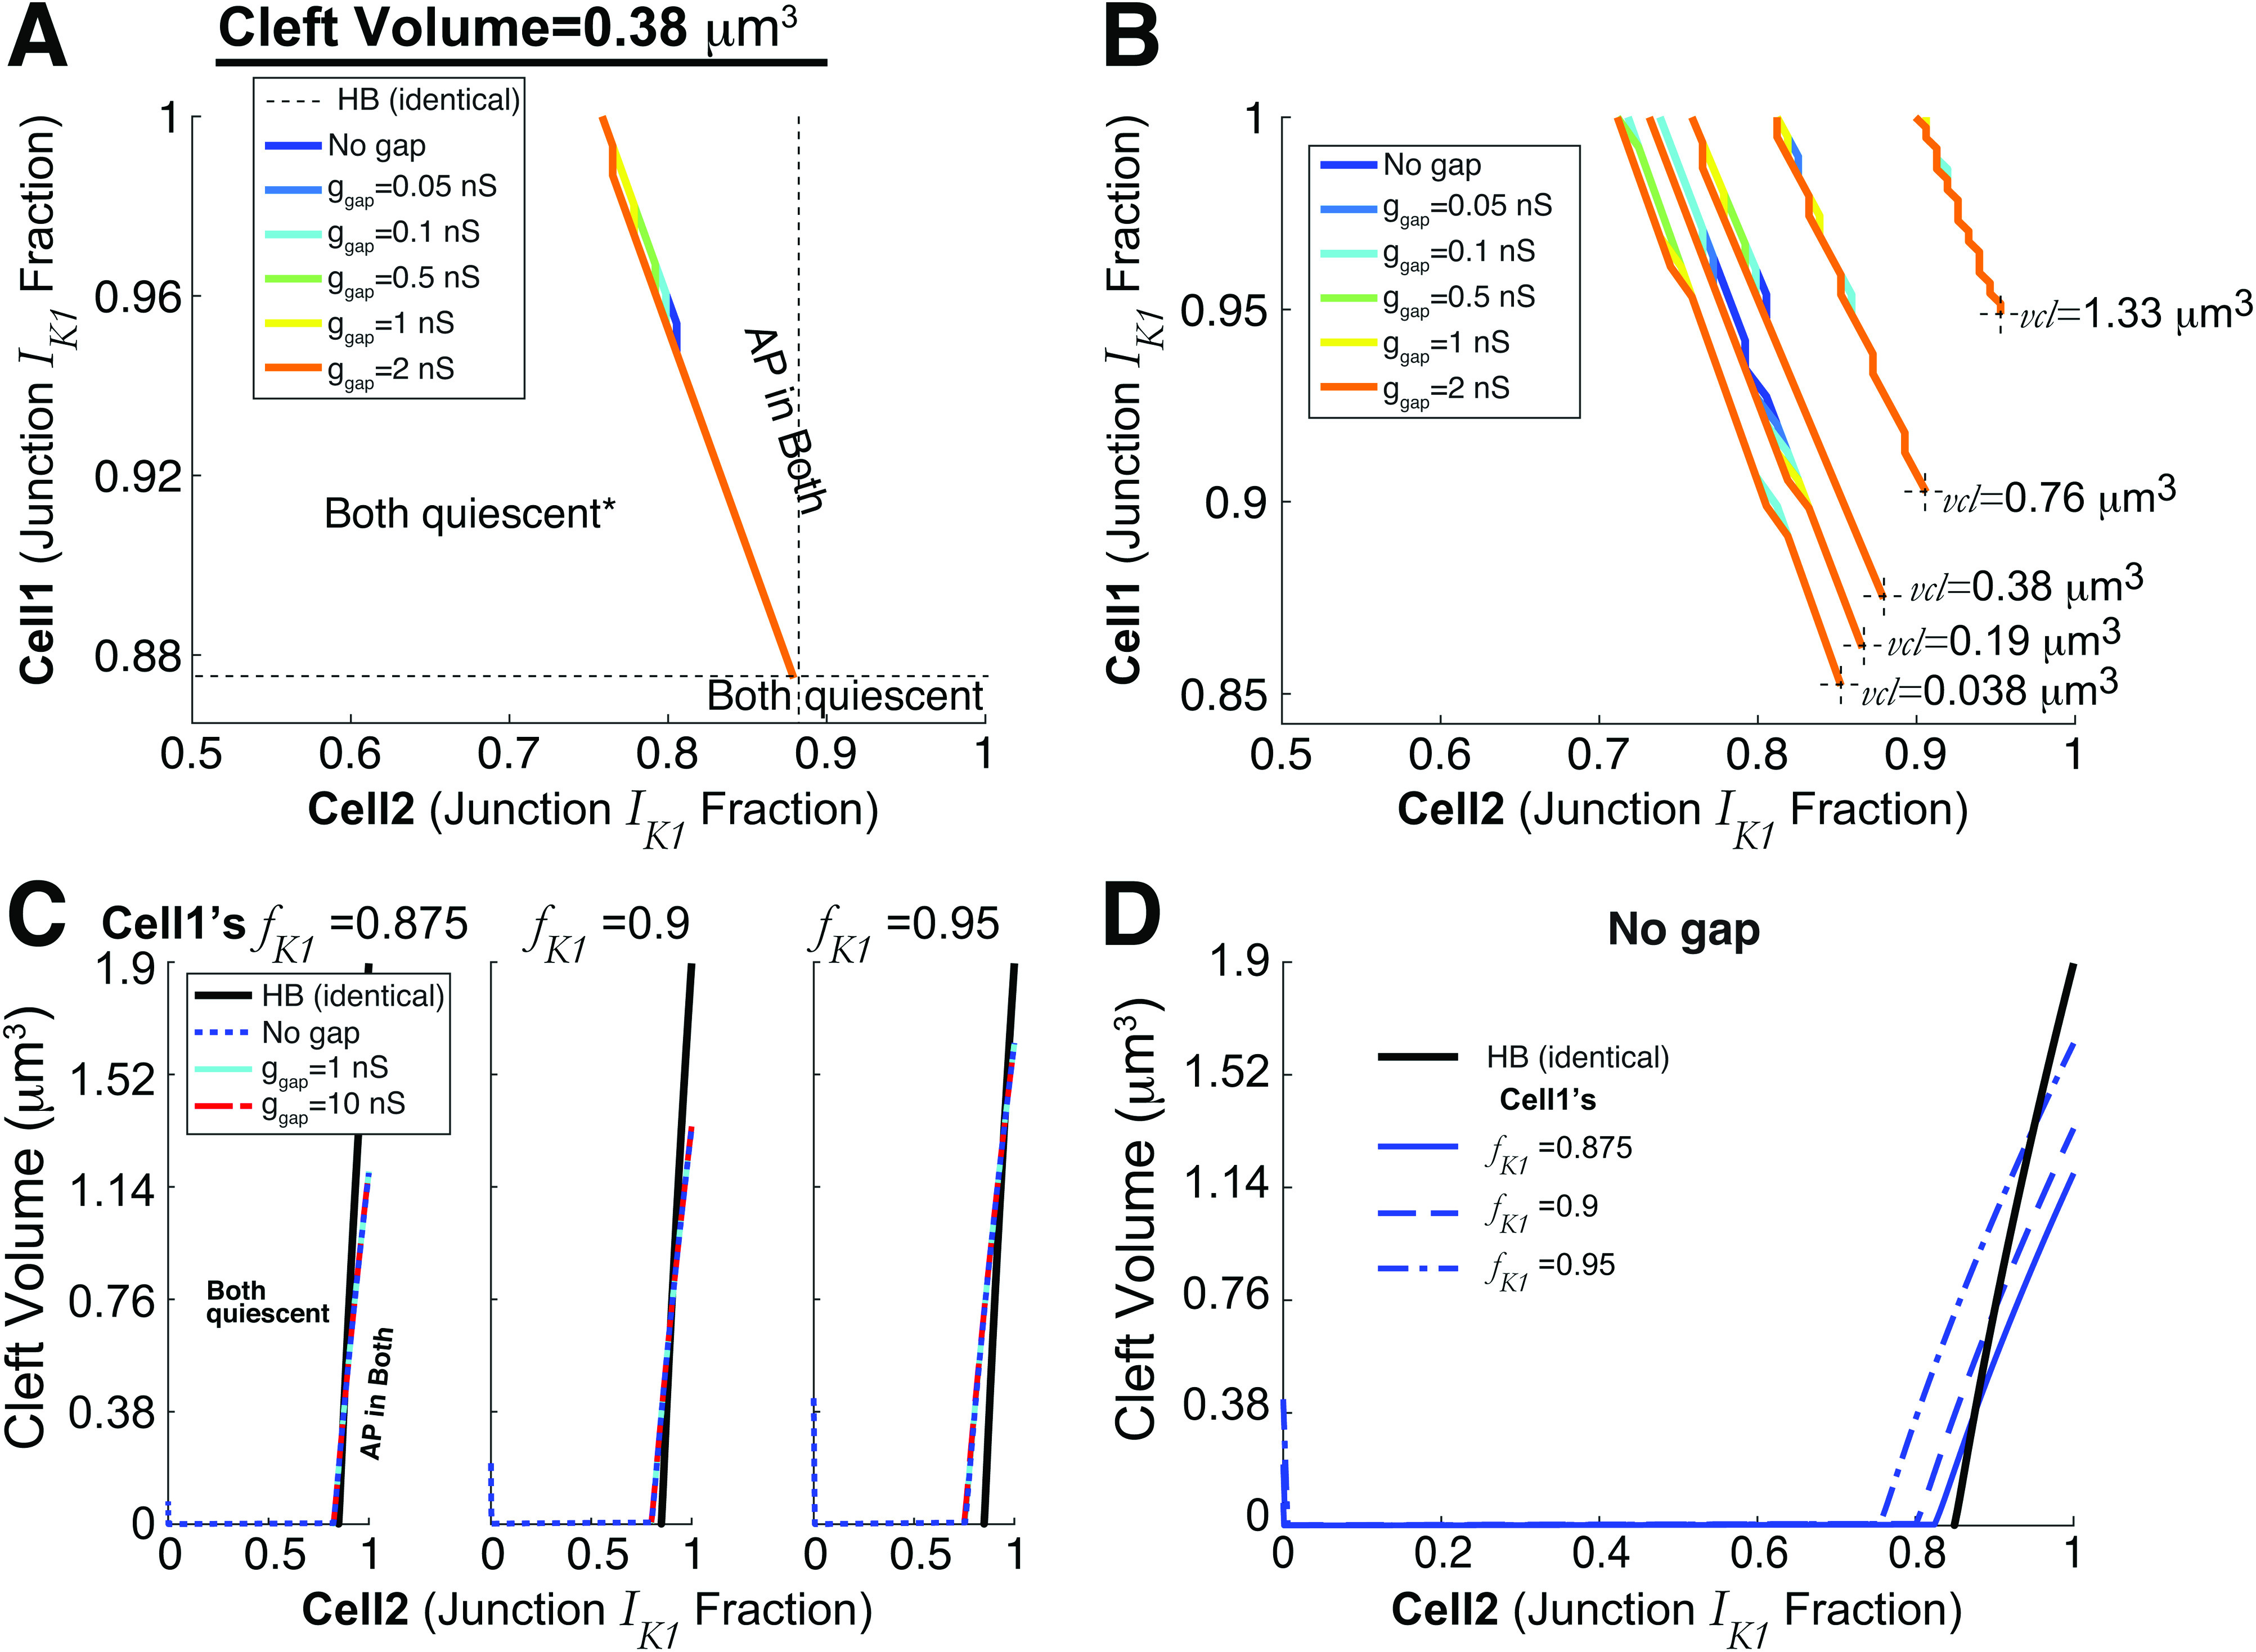
FIG. 7.

Automaticity regimes in heterogeneous cell pairs with ephaptic and gap junction coupling. (a) Gap junction coupling strength has negligible influence on the regimes for which automaticity occurs. Black dotted lines are the reference point for the Hopf bifurcation (HB) for the minimal for automaticity for identical cells and (cleft volume ). Note that the asterisk in the left region of “both quiescent” indicates that for and small , cell-1 triggers APs and cell-2 has sub-threshold oscillations [recall Fig. 6(c)]. However, this only occurs when ; for , both cells are quiescent in that region. (b) Similar plot as (a) for various cleft volumes —the boundary for automaticity shifts but varying does not significantly change regimes for automaticity. The black dotted lines denoting the HB point are shorter to avoid clutter. (c) Detailed two-parameter bifurcation diagrams, fixing cell-1’s ( ), with cleft volume on the vertical axis and cell-2’s ( ) on horizontal. As in (a) and (b), gap junction coupling does not alter the boundary for which both cells are triggering APs. The near vertical line for (blue dotted) for small is indicative of the dynamics described in Fig. 6(c). (d) The blue curves (no gap junction) in (c) are shown on a single axis, related to Fig. 3(f) (black).
